


Hardware components | ||||||
_ztBMuBhMHo.jpg?auto=compress%2Cformat&w=48&h=48&fit=fill&bg=ffffff) |
| × | 1 | |||
 |
| × | 1 | |||
Software apps and online services | ||||||
| ||||||
Electronic systems rely on two types of signals: digital and analog. Digital signals can only be one of two discrete quantities, such as 0V and 5V. Analog signals can be any value on a continuous scale, for example, anything between 0.734V and 4.378V.
Depending on the application of the signal, one type or the other is more suitable. For example, digital signals can easily be interpreted as high or low (1 and 0), and this is the basis for using binary code to transmit information, such as data through a USB connection. If, however, the goal is to control the brightness of an LED, or the speed of a motor, some values between "on" and "off" are necessary. One way to solve this issue is to utilize an analog signal, perhaps via digital-to-analog converters. These require additional hardware and programming, and most applications that require an analog signal can use a simulated analog signal just as well. This is where pulse width modulation (PWM) comes into play.
The image above shows an example of two PWM signals generated by an Arduino Uno with the analogWrite function. As you can see, the outputs are pulses of high and low outputs, with varied (modulated) width, not analog signals at all. The "duty cycle" is an expression of what proportion of the signal's period is spent in a high state. A 100% duty cycle would mean the output is constantly high, a 50% duty cycle would mean that half the period is high, and half is low, and a 0% duty cycle would mean that the signal is constantly off. See the images below for a comparison of the duty cycles. Notice how the duty cycles relate to the percentages the pulses are high compared to each other. PWM can be used to generate either a simulated analog signal, or for communicating with devices. Both use-cases will be discussed.
To view a PWM signal on a WaveForms Live, first set up a PWM pin on an Arduino. Any of the digital pins that have a ~ symbol next to them are PWM-enabled. The function analogWrite() will generate the desired output. Attach the OpenScope oscilloscope probes to the output and ground on the Arduino, and in WaveForms set the trigger to rising. Then press either Run or Single to capture the signal. This basic technique was used to capture all the charts in this project.
PWM can simulate analog signals because many circuit elements that take analog inputs respond to the average input, not the value at any given moment. An RC (resistor-capacitor) filter can help convey how the average output of the PWM relates to the duty cycle. Capacitors store energy and release it over a period of time, so they are able to average signals out. In the series of images below, the yellow line represents the PWM signal, while the bottom line is the voltage seen through the filter. Notice how this line is approximately flat and analog (not discretely 0V or 5V). The duty cycle of the PWM signal directly relates to the analog output amplitude relative to the maximum (5V), i.e. a 25% duty cycle creates an approximately 1.25V signal, which is 25% of 5V. This smoothing characteristic can be taken advantage of to create analog-like behavior in a variety of devices, such as LEDs and DC motors.
LEDs appear dimmer when they are supplied a shorter duty cycle. The reason is similar in principle to the RC filter example, although in this case, human eyes cause the averaging instead of the capacitor. Brightness is perceived as the relative amount of light that enters the eyes in a certain amount of time. Humans can't consciously perceive flickering over 30Hz, so blinking an LED faster than this speed will result in it appearing to be constantly be on. The duty cycle of the PWM determines how long during each period the LED will be on. Therefore a shorter duty cycle will cause fewer photons to be emitted, and the LED will appear to be dimmer. This is similar to how a capacitor smooths the PWM signal into the average voltage.
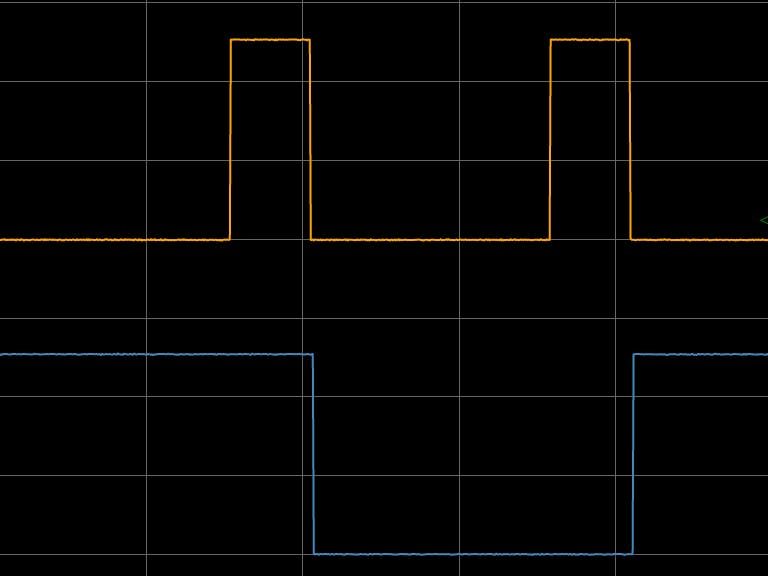
A photoresistor, or light-dependent resistor (LDR), seen in the image above, varies its resistance depending on light intensity. An LDR can be used to approximate the luminosity of the LED. They have relatively slow response times (in the milliseconds), which makes them a good analogue for the human eye, which also doesn't respond to changes in light very quickly. In the images below, the orange line is the LED voltage and the blue line is the voltage across the photoresistor. Clearly, the LED is rapidly turning on and off, but the photoresistor is sensing this on-off sequence as a variable luminosity. If you'd like to replicate this experiment, take a look at this project about LED brightness control through PWM.
Note: The LDR used in this project reduces its resistance as luminosity increases, so the voltage across it becomes smaller as the LED brightness/duty cycle increases.
Using the LDR to measure the luminosity of a red LED, the chart below was generated.
A DC motor can also be controlled by PWM, and again this has to do with taking the average of the signal over time. Motors have inertia, which means it takes time to spin up and spin down. Like the capacitor, a DC motor will not respond instantly to the appearance or disappearance of a power signal, and will instead smooth out the energy input. Thus, if given a 50% duty cycle, the motor will only be powered half of the time, and will spin at half of the speed it would at a 100% duty cycle.
Controlling RC Servo Position with PWMWhen it comes to servos, the other aspect of PWM becomes clear. Servos are a type of electric motor that move and hold specific positions when instructed by some mechanism. The most identifiable servo is one used in RC airplanes, where they are employed for control surface manipulation. PWM is used to set the position, but not to supply energy for the movement. Typically, the range of motion for RC servos is 180°, and correlates to the length of the pulse supplied in the communication wire. A pulse width of 1ms sets the servo to -90°, and a pulse width of 2ms sets the servo to +90°. To set it to the middle, the pulse width needs to be 1.5ms. Although this application doesn't explicit require PWM, an easy way to control the on-duration of the signal is to use PWM with a varying duty cycle. For example, if the degree range was to be mapped to a 20-40% duty cycle, a PWM signal with a frequency of 200Hz would generate the correct length pulses.


Comments
Please log in or sign up to comment.