


Hardware components | ||||||
 |
| × | 1 | |||
_ztBMuBhMHo.jpg?auto=compress%2Cformat&w=48&h=48&fit=fill&bg=ffffff) |
| × | 1 | |||
 |
| × | 1 | |||
| × | 1 | ||||
 |
| × | 2 | |||
Software apps and online services | ||||||
| ||||||
 |
| |||||
Note: In order to use the photoresistor, you'll first need to characterize its response to light intensity, which is covered in this article. For the following article, it's assumed you have established arelationship between the photoresistor's value and the intensity of light falling on it. If you're interested in a more in-depth exploration of how servos work and how to characterize their response to signals from an Arduino, please read this article.
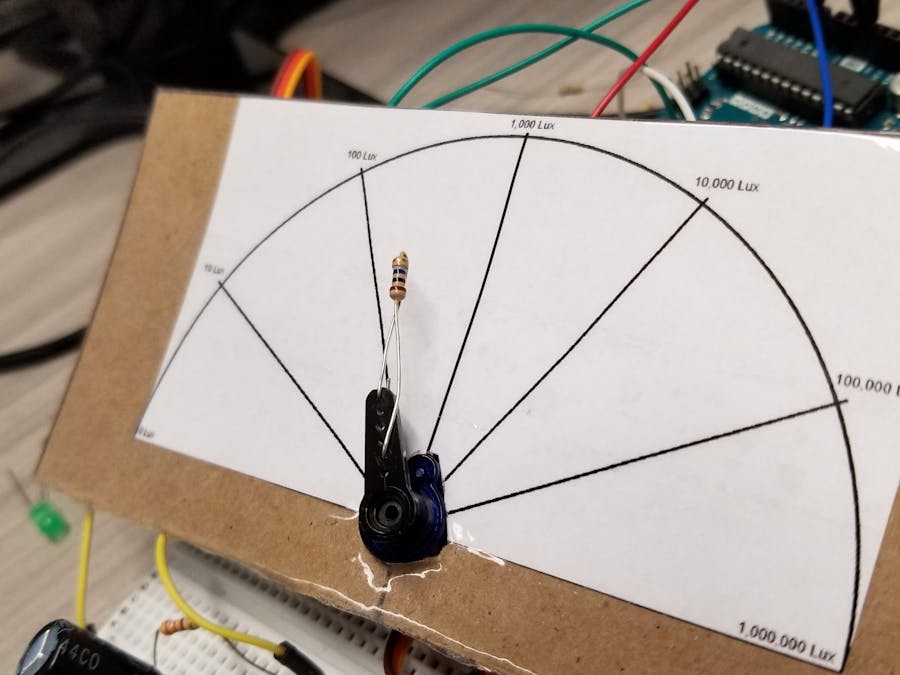
IntroductionThe goal of this project was to create a servomotor-based gauge to display the intensity of light striking a photoresistor, measured in units of lux. The photoresistor (whose resistance changes in relation to the amount of light falling on it) is in a voltage divider configuration with a 220Ω resistor. An analog pin on the Arduino is used to measure the voltage in the divider, which varies as the brightness detected by the photoresistor changes. The Arduino then changes the servo position in response to the change in voltage. The following schematic and breadboard diagrams show how to arrange all the electronic components necessary for this system.
I previously characterized the photoresistor's behavior by using my cell phone's ambient light sensor, an OpenScope, and WaveForms Live. By using an Android app called Sensors Multitool (Lirum Device Info Lite for iPhone also works), I was able to get lux measurements for various light sources and correlate those values to the voltage measurements I saw in WaveForms Live. Since many of the light sources I chose used PWM to modulate their brightness, it was useful that WaveForms Live has a built-in function to calculate the mean value for voltage.
Once I had the characterization done, I used Excel to graph the data and generate lines of best fit. I ended up using four different equations to cover the photoresistor's full range while maximizing the R² values: 0-0.534V, 0.534-2.9V, 2.9-4.1V, and 4.1-5V. This covers 0 to 1, 000, 000 lux, or complete dark to a very bright bike light held directly to the phone's sensor.
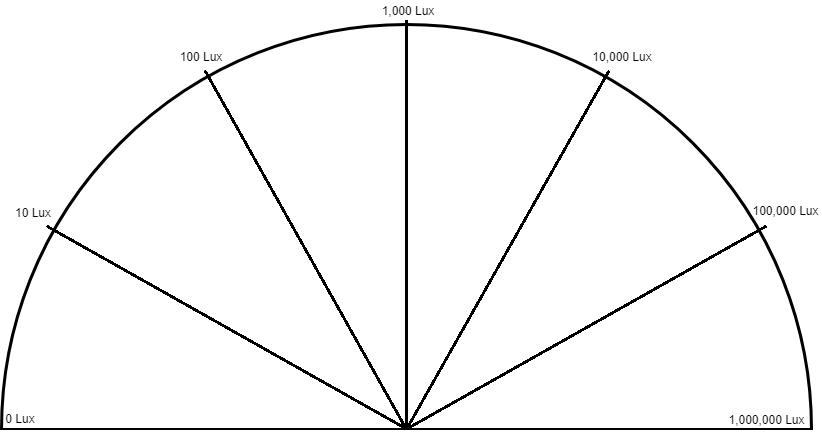
I used Arduino's Servo library to control the R/C servo. The library uses degree values to set the position of the servo, so I had to map the lux scale, which is best viewed in log base 10, to a 0-180° scale. I selected the seven lux values seen on the y-axis on the chart above, spaced them 30° apart, and used Excel to generate a line of best fit for those points. The graph below generated the equation that was used in the Arduino's servo positioning command.
With all the equations generated, they had to be implemented into the Arduino code. The program initially included only two functions: one to measure the brightness, and one to position the servo. I later added a third function, discussed at the end of this write-up.
In the measurement function I used four if-else statements to tell the Arduino how to interpret the voltage divider measurement on the analog input pin. These commands use the four equations from the "Photocell Characterization" graph.
The servo position-setting function simply implemented the equation from the "Lux-Degree Correlation" graph. The x-value found in the line of best fit equation was replaced by the lux value supplied by the function above.
Jerky BehaviorOverall, the code worked for visualizing the amount of light falling on the photoresistor. However, there were some areas where the servo would start to swing wildly before settling into a reading. It would also experience subsequent oscillations at random times. By using WaveForms Live to look at the servo control signal and the voltage divider measurement, I was able to gain some insight into why this behavior happens.
Primarily, the "jerky" behavior was observed in low-light situations, such as when I held my finger on the sensor to block all light. At this point, the voltage at the divider is nearly zero. However, because the servo is powered by the Arduino, and because the servo draws a significant amount of current when the motor is active, the voltage divider sees noise during the periods the servo is re-positioning itself. At the low voltage levels associated with near-dark, the noise manifests itself in the form of voltage spikes. These spikes cause the Arduino to re-position the servo, which causes subsequent spikes. Optimally, the servo should run off of a separate power supply that can source the necessary current without dropping the voltage.
The images below demonstrate the issues caused by the servo. In the first image, the Arduino was programmed to bring the yellow signal low whenever it was reading the photoresistor voltage (the blue signal). Notice that there are some instances where the photoresistor voltage is spiking or dipping right as the Arduino is taking a measurement. The second image shows the dip in photoresistor voltage immediately following a servo command signal.
A second factor contributing to the servo's oscillations lies in the decision to map a logarithmic scale to a 0-180° scale. This means is that a change from 0 to 10 lux results in the same degree shift as from 100, 000 to 1, 000, 000. Thus, small fluctuations in voltage on the "dark" side of the scale cause relatively large movements compared to small fluctuations on the "bright" side. A change of 10mV near 0V would cause the servo to move 4°, whereas a change of 10mV near 5V wouldn't even move the servo a single degree. This is a design decision that may be flawed, but, in my opinion, is appropriate to how my eyes perceive brightness: I can easily detect the difference between 0 and 10 lux, whereas from 100, 000 to 1, 000, 000, the light goes from blinding to slightly more blinding.
Solution: Software FilterTogether, the hardware and software factors combine to make the servo unstable at low voltage levels. My initial design included a 1000µF capacitor to filter the servo-caused noise, but this was clearly insufficient. The solution was to implement a software-based filter in the form of a running average.
Initially, an array of floats was used to calculate the average, but the Arduino Uno's limited memory was causing inconsistent performance, so a slightly different solution had to be found. Normally, a running average is calculated from a sum of the measurements, and as a new measurement is added, the oldest is discarded by subtraction, thereby updating the value. However, this requires that the values comprising the sum are all kept in memory, which results in a large memory load when dealing with float data types. Another, slightly less accurate, method is to subtract the average value from the sum, instead of the oldest value, thereby removing the need to keep old measurements in memory. This works well when the measured values are approximately the same in the sampling period, which is true with the light sensor. If all the values in an average are the same, then subtracting the average would be no different than subtracting the oldest value. (If this makes no sense, try adding the same number together a couple of times and taking the average. Now, is there any difference between the oldest value and the average?)
I found that the best balance between responsiveness and noise damping required 50 samples in the running average. The size of the running average window needs to be long enough that any spikes in voltage are outweighed by the correct voltage readings, but short enough so that the system is able to respond quickly to changes. Additionally, the rate at which samples are taken is important, especially with the servo. Too short a window will cause the Arduino to take a measurement while the servo is still moving, which generates noise, and too long of a window will also cause it to see noise, since the next period of the command signal starts after 20ms. For this reason, a 15 millisecond pause between moving the servo and taking the next sample seemed to be the sweet spot.
With the software filter implemented, my gauge was no longer unstable in the low voltage range, and was able to quickly respond to changes in lighting. An interesting result of the modified running average was that the gauge was quicker to respond to an increase in brightness than it was to a decrease. Also, the fact that the low-light end of the scale results in large degree changes for small signal variations still caused the gauge to twitch in the 0-10 lux range, but this is an artifact of mapping a logarithmic scale to a linear one.
You can find the both the final version of the Arduino code and image I used to make the lux gauge attached at the bottom.


Comments
Please log in or sign up to comment.