The project aims to use a flow-rate sensor to capture water consumption of a household and upload the information of water used and water bill to the web to allow residents to view them in smart devices.
2.0 Project planning:We made use of a DC pump to simulate water flow into the household. The pump speed is varied by a voltage controller to assimilate real-life conditions of varying water flowing over time. The water pump and flow rate sensor are mounted along a water piping to detect the amount of water flow into the household.
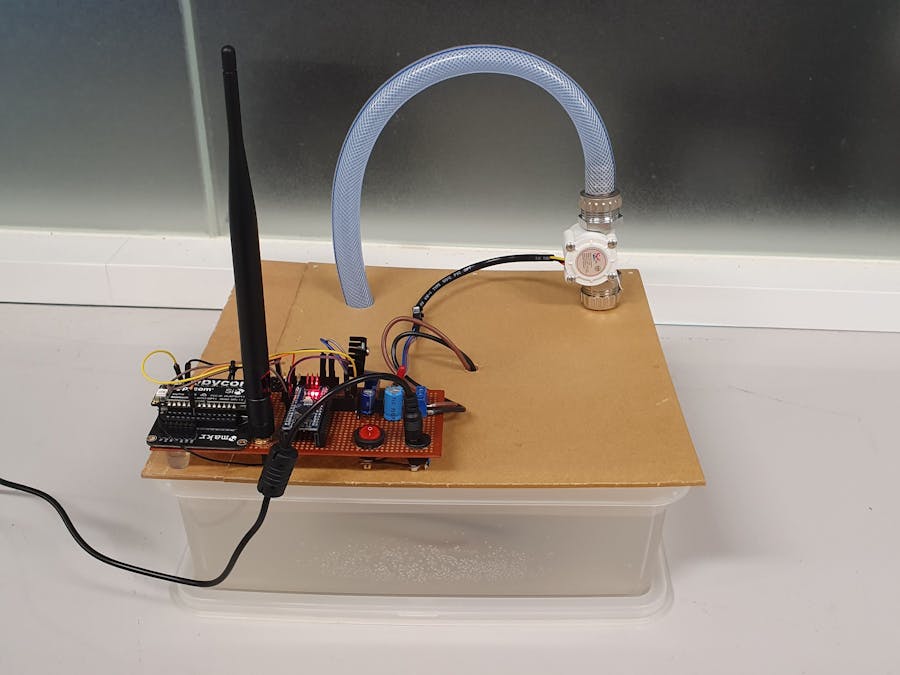
Figure 1 shows the construction of the Liquid Flow Sensor and Bilge Pump mounted below in a water container.
Figure 1
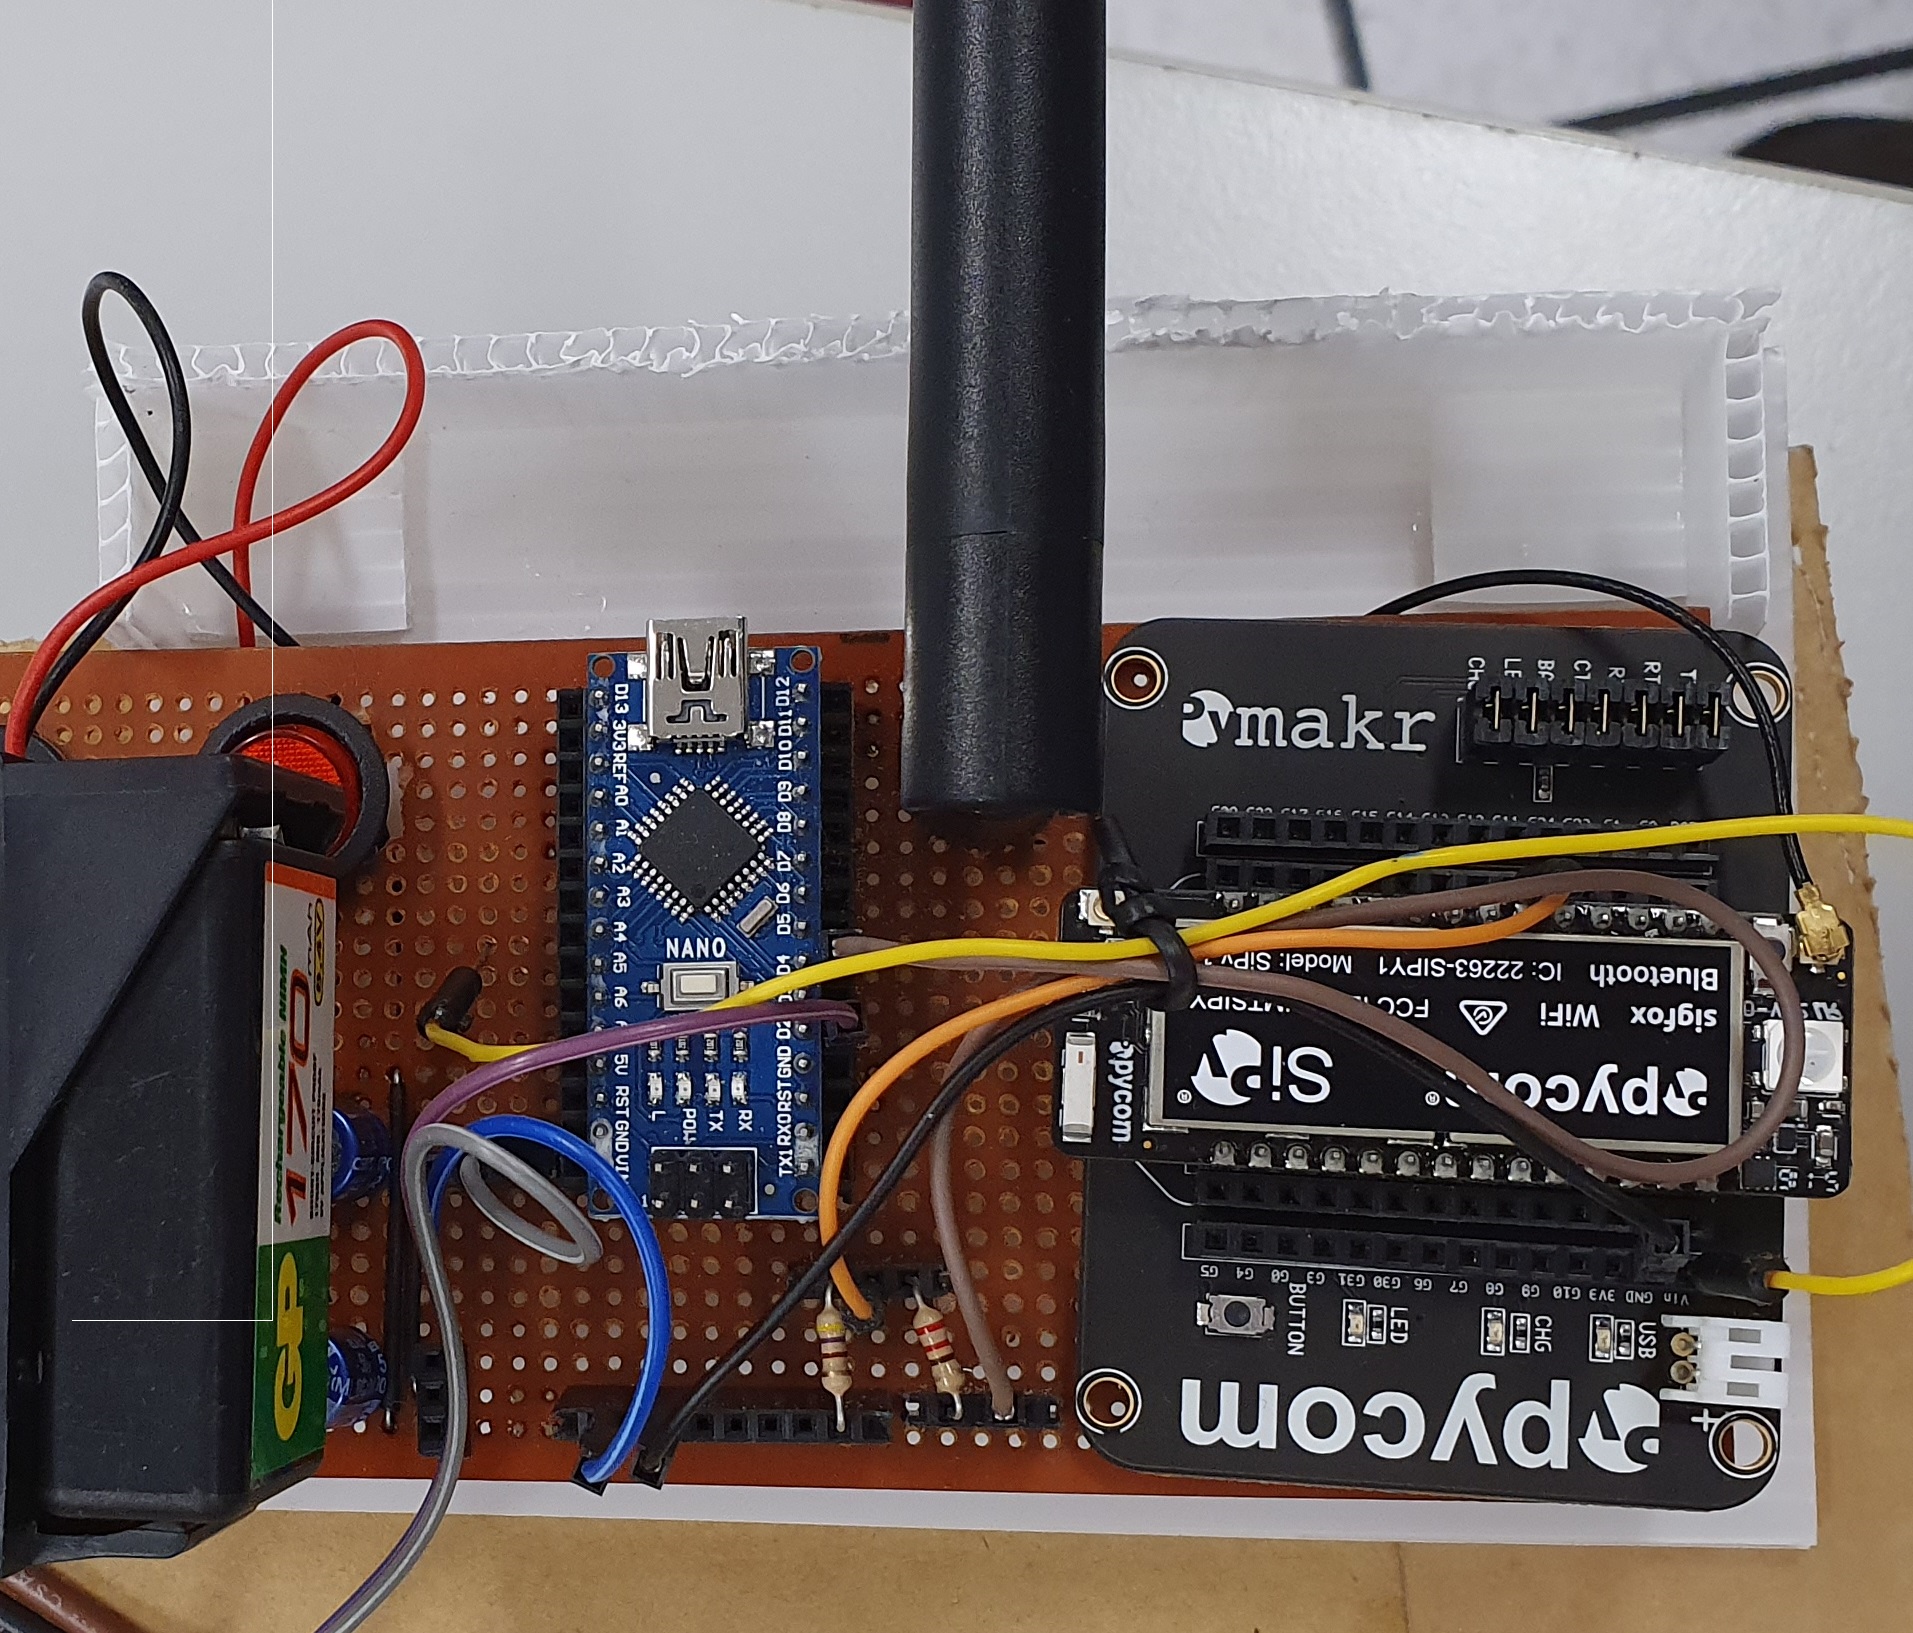
Figure 2 shows the construction of the interfacing board between the controller boards and sensors.
Figure 2
3.1 Two-Speed Pump design
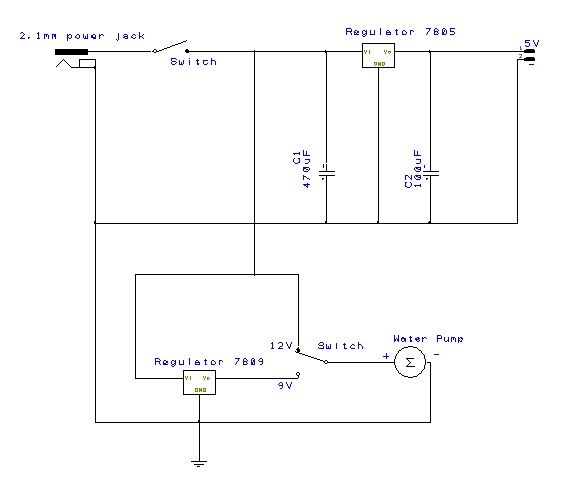
Pump speed is controlled by changing the operating voltage to either 12V or 9V to change the flow rate of the pump. A toggle switch is used to change the pump speed for the project.
3.2 Liquid Flow Rate Sensor
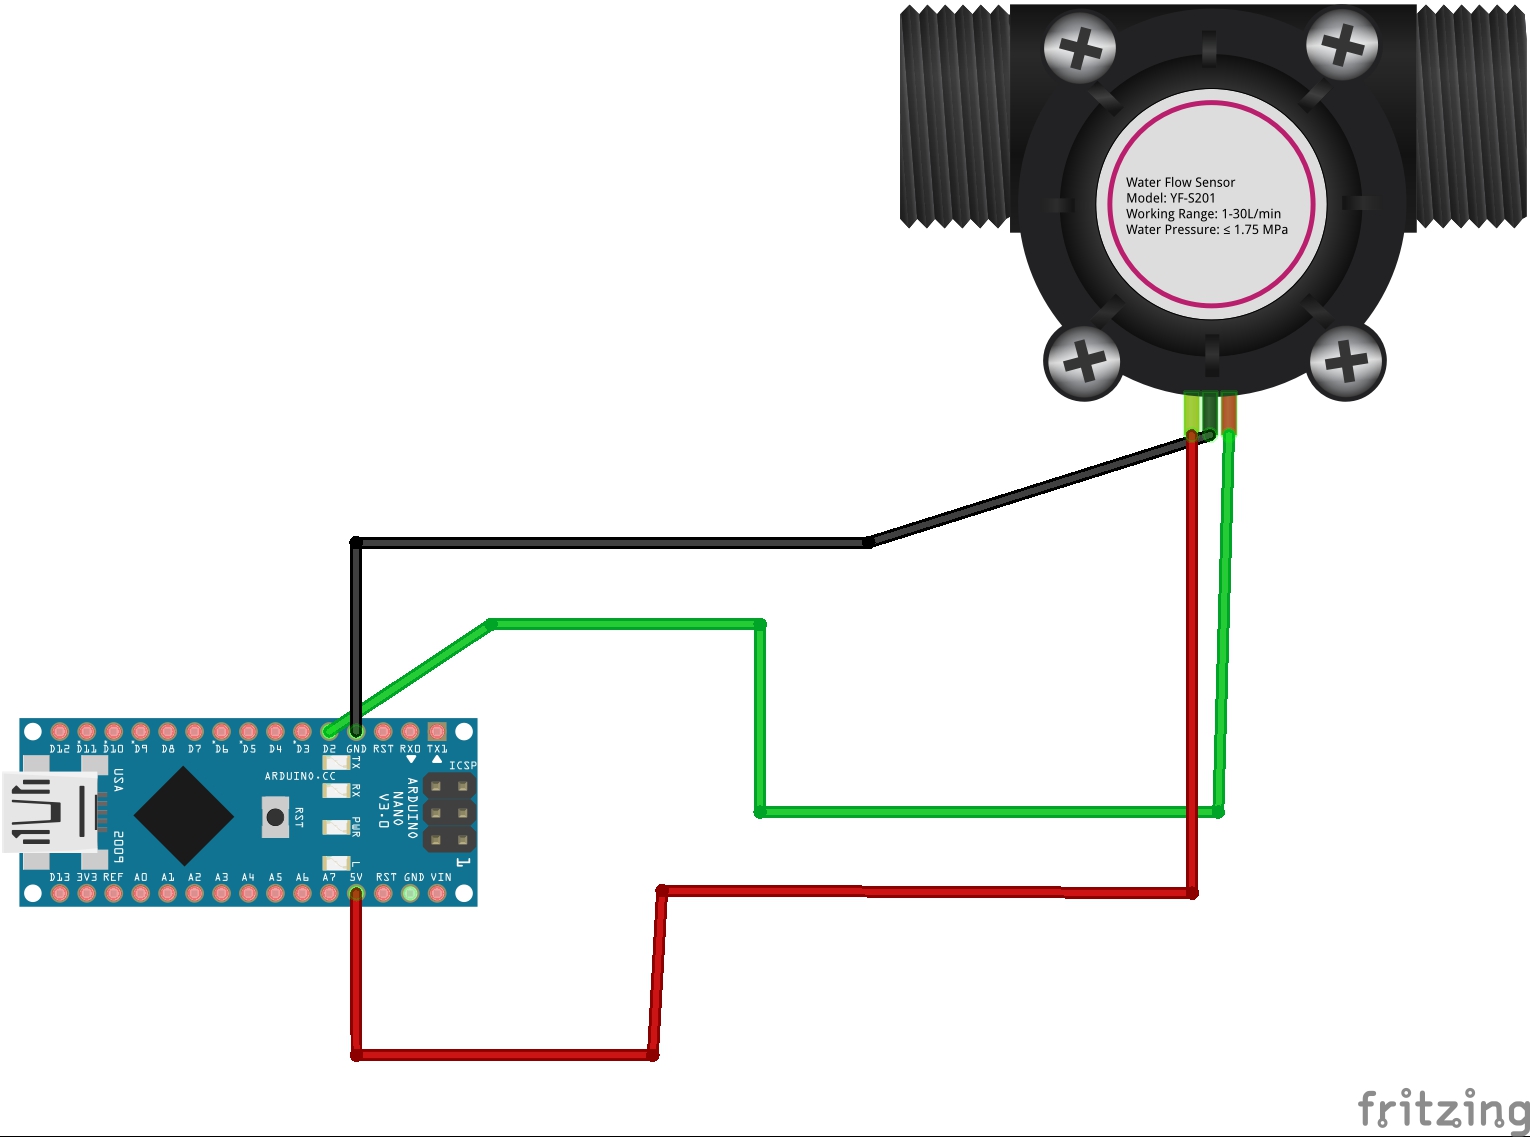
A Liquid flow rate sensor is used to detect the amount of water flow over time. Arduino Nano board is used to capture and compute the pulses of voltage generated by the flow rate sensor.
Figure 3 show the connection of Flow Rate sensor with Nano Board.
3.3 Power Supply for Nano & SiPy Board
The main 12V power supply from the adaptor to the power jack is connected directly to pump and also to 5V regulator for Arduino Nano & SiPy board.
3.4 Logic Shifter (Logic Converter)
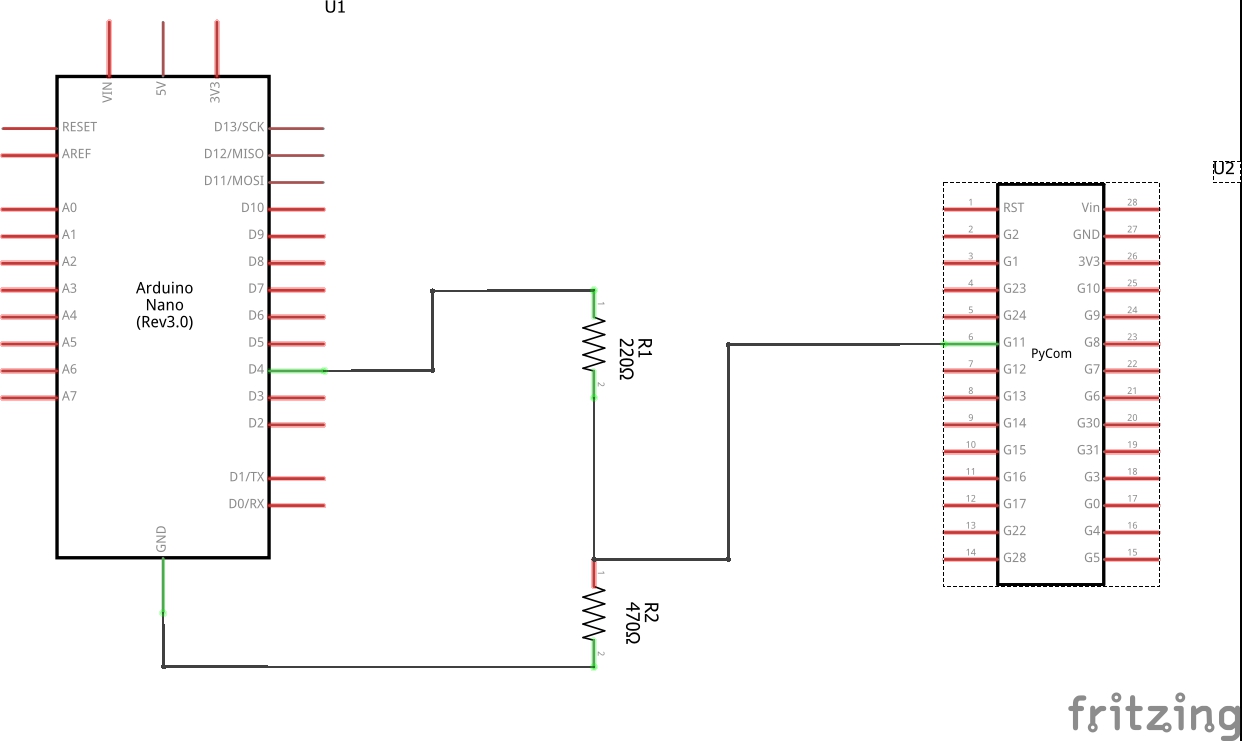
The 5V output from Arduino Nano is sent to a voltage divider to convert the data to 3.3V. For this resistor network, we are using 220 ohm and 470 ohm resistors.
Figure 4 shows the schematic of a logic shifter
3.5 ON/OFF Switch
We are using a rocker switch to cut off overall power supply when not using.
3.6 Schematic circuit drawing
4.0 Softwarefor thePrototype
4.1 We are using Arduino 1.8.8 IDE for our Arduino Board development.
4.2 We are using Visual Studio Code 1.39.1 for SiPy Board development.
4.3 We are using Thinkspeak for our cloud display and data analytics.
5.0 Thinkspeak Account & PasswordOur group used Thinkspeak account with email m6.iot06@gmail.com and password is Ite123456
6.1 Arduino output
Figure 7 shows the flow rate result from Arduino output.
6.2 Thinkspeak Raw Upload (High/Low Byte)
Figure 8 shows Thinkspeak raw upload data. SiPy board upload decimal value in High Byte and Low Byte format to represent number before decimal (High byte) and number after the decimal (Low Byte) to Thinkspeak.
6.3 Thinkspeak Matlab Analysis output
Matlab Analytic recombine the High byte number together with the Low byte number to recover the decimal value of the volume of water and bill computation.
Figure 9 shows the graphical representation of the actual flow rate and overall consumption with the respective water bill as of that instant.
6.4 Prototype in action
6.5 Comment on the output data
Flowrate graph shows peak and dips along with time. This indicates water flow varies with time due to change in water consumption over the daytime and night time.
The Total consumption graph shows the cumulative volume consumed at any one time. It has a positive gradient.
Total Billing is the computation of the cost per meter cube multiply with the cubic meters of the water consumed.
In this case, the cost per cubic meters in Singapore is estimated at S$2.70/m3.
Total Billing graph is in positive gradient profile as Total consumption graph as both indicate total water consumed.
Overall both hardware and software of the prototype are working well and displayed data tallied well with the real-time conditions. The upload timing is reasonably prompt with very minimal latency (~ a few seconds).
7.0 Power source & battery lifeWith the current battery technology, we can have a high current capacity rechargeable lithium-ion battery. Currently, the available battery is shown in Figure 10.
Battery life calculation as follow:
The device consumed approximately 16mA when active and negligible when in deep sleep.
Assuming average water flow per day is 2hour, then 1200mAH can last for 60 hours or approximately one month.
Of course, we can further explore the self-charging capability from the water flow in the pipe. We shall exclude the scope of this for this competition.
Alternatively, we can also use a portable 10000mAH power bank pack for the prototype which may last more than 10 months.
8. Prototype AppearanceFigure 11 shows the complete assembly of the prototype.
The team had work hard on this project. We have overcome many setbacks and challenges throughout the development of the prototype.
Gathering the fund for the project was our first challenge and we managed to get the school project fund to kick off this project.
The timeline was very tight as most of us have other commitments to our course of study. We planned and commit our schedule wholeheartedly.
Technically, the sensor testing went off well and all circuitries were tested out smoothly. There were some minor heat dissipation problems and we resolved it by using a heat sink.
The most challenging of all was to learn how to use SiPy board and the Visual Studio Code.
Registering the board took us quite a while and then coding using Visual Studio code was new to us.
We manage to get things done via web guide and advice from seniors. We would like to thank Sipy Pycom web help and guidance, and all helpful web pages pertaining to Sipy and Visual Studio Coding which we had learned to use them in our project development.
We also wish to express our thank to the organiser of this event to provide us with the hardware Sipy PyCom board for us to explore at the very early stage of the project development phase.




Comments
Please log in or sign up to comment.