In the past I've used processing to display live data from an Arduino, but I wanted to see if the new serial plotter tool could do the job. On my first attempts the data was scrolling by so fast I could barely see it, and that also caused the re-scale feature to constantly shift the display around.
Fortunately, you can bring the vertical axis under control by adding a few delimiter separated constants before the final data:
 println:
Serial.print(4000); Serial.print(” “);     // sets a stable upper value line
Serial.print(0); Serial.print(” “);           //  this constant sets a stable lower value
To prevent the x axis from scrolling too fast, I set the main program loop to monitor the ADC and only capture as set of readings for output to the serial plotter when the readings go above a certain threshold:
uint16_t  ADCreadings[500];    // define an array to store the readings
void loop(void) {
if(analogRead(analogPin) >= LoopThreshold){
//  the capture loop
start=millis();
for (int Cycle = 0; Cycle < 500; Cycle++)
{ADCreadings[Cycle]=analogRead(analogPin); }
elapsed=millis()-start;  // tells you how long it took to take the samples
// the output loop for the text monitor or serial plotter
for (int Cycle = 0; Cycle < 500; Cycle++) { Serial.println(ADCreadings[Cycle]); }
}
}
To use this method you need to do a few runs with the text monitor window to see what your threshold setting should be, I typically set the threshold about five points above the systems resting state. Once the threshold is set the serial plotter behaves more like an oscilloscope’s triggered sweep: scrolling new readings across the screen each time the readings start to rise.
Another benefit of this approach is that you can do complicated calculations in the output loop without affecting the sampling speed. In the graphs shown on this page I've converted the raw ADC counts to μA at the output stage. And since you can add several constants to the serial plotter output, it becomes possible to determine the value of a specific point on the plot by intersecting it with a new line:
Now that the serial plotter is behaving nicely, I can move on to the task at hand:
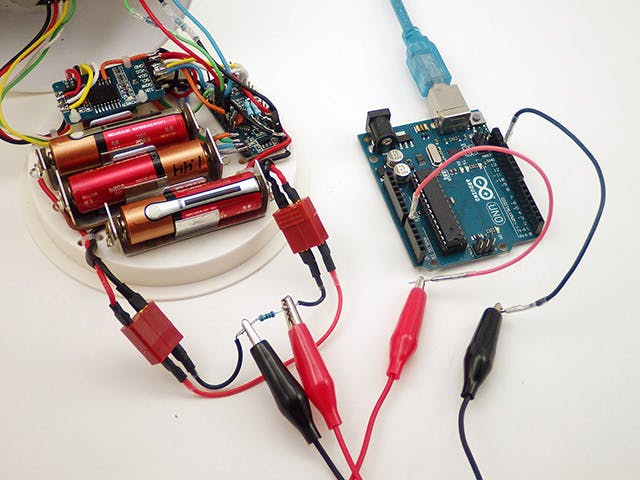
Tracking Brief Low power events with an Arduino UNOIn this application, I wanted to use an Arduino to track the current drawn by a drip sensor I built with a Promini style board. To do this I read the voltage drop across a shunt resistor with the UNO’s ADC. The Arduino takes reading by comparing the analog input to it's own ground, so the black wire is needed to connect the two ground lines. Placing the shunt resistor on the low side line like this causes the Promini's effective ground line to move around as the current through the resistor changes, but in this case that "floating ground line" should not cause problems.
Another challenge of the shunt resistor method is balancing the ADCs resolution with the other limits imposed by the method itself. The Arduino’s native ADC delivers 10-bit readings, (ie 0-1023) with a default resolution of ~4.8 millivolts. Even if you increase the sensitivity by changing to the internal 1.1 volt vref, you only reach 1.1v/1024 steps = ~1 millivolt per bit.
With an upper limit of 1.1v on the ADC input, and a potential 100mA peak current in the drip sensing datalogger during SD card writing events, the largest shunt resistor I can use is 1.1v/0.1a= 11Ω. But allowing the voltage drop on the shunt resistor to get that high imposes another challenge in that the drip logger would only be left with 4.5v (from the 3xAA battery) – 1.1v drop = 3.4v. That’s right at the minimum needed by the 3.3v regulator on the Arduino promini board, risking a potential brown-out in the middle of the SD card writing process. The drip loggers sleep at 0.2 mA x 11Ω shunt resistor = 2.2 mV - so at the low end of the scale we are right on the limit of the ADC's resolution.
But hey, lets pop in some fresh batteries, and see what we get anyway:
Not too bad, but that’s a noisy plot with lots of jitter on the base line. Having 1-2 bits toggle like that is typical for ADC’s so there is probably nothing I can do to get rid of it. And the drip sensors resting state reads at zero when it should be registering at least two counts. It is also common for an ADC to under or over read by a few bits at the low end, so I added an offset adjustment into the code to bring that sleeping current baseline up to the 0.2 mA that I had already confirmed with a multimeter.
Since I did not know how long the event would be I initially had a 400 us delay in the sampling loop. Here's what happened when I took that out and let the ADC run a full speed:
That's over 8000 samples a second! Far too many readings for the serial plotter to handle if I want to look at longer events. But how do I maintain the Arduino’s ability to spot really short current peaks, but only send 500 readings to the screen?
Adding long delays to the code would miss those brief events so I decided to create an “oversampling loop” that creates a kind of running average using a low pass filter, but also checks for peaks throughout the process. You can dig into the code for this over at GitHub, but the basic idea that is if a peak occurs, then the highest reading in an interval becomes the final reading. If a decreasing trend is found, then the output from a leaky integrator becomes the final reading for that interval. So the readings get smoothed on the way down, but not on the way up.
Here is a try with the oversampling interval set to six ADC readings:
That’s an RTC triggered logger event and the drip triggered event captured at the same scale. Now here’s another run with a 15:1 ratio:
Squashing more than 7000 raw readings into a 500 line display really starts to distort the curve, but everything is still recognizable, and more importantly, the peaks did not get chopped off like they would have if I just slowed down the sampling loop with delays.
So this method lets you adjust the serial plotter’s display to match the timing of the event you are trying to see, provided you don’t over-interpret the accuracy of those heavily averaged interval numbers.
Capturing longer records:Hopefully they will expand the plotter tool with export capabilities in the future, but for now you can manually move data out of the text monitor and simply paste it into Excel. Before you start a long run for export to a spreadsheet, comment out the extra constants that you were printing to stabilize the y – axis on the plotter, so that only the numbers you are interested in are sent to the serial text display. Then after your Arduino DAQ has been capturing events for a while, click inside the serial monitor window, select all the data and copy it (on a windows machine that would be [CTRL]+[A] followed by [CTRL]+[C] ) then open a new spreadsheet and simply paste the data into an empty column.
This lets you compare the different events side by side:
Note: The material I've posted here is an excerpt from a much longer post over at my blog, where I also put a 15-bit ADS1115 ADC module through it's paces. Hop over there if you want to see how that compared to the Arduino's native ADC. If you are curious about the platform pictured in this tutorial , you can read a paper about how we use these Arduino based data loggers for research at: http://www.mdpi.com/1424-8220/18/2/530 which is an open access journal, so the PDF is free to download.
And: The folks over at Measuring Stuff posted a great page called The Arduino DAQ Chronicles, which provides more great background on the subject of using an Arduino in this kind of application.


_ztBMuBhMHo.jpg?auto=compress%2Cformat&w=48&h=48&fit=fill&bg=ffffff)


Comments
Please log in or sign up to comment.