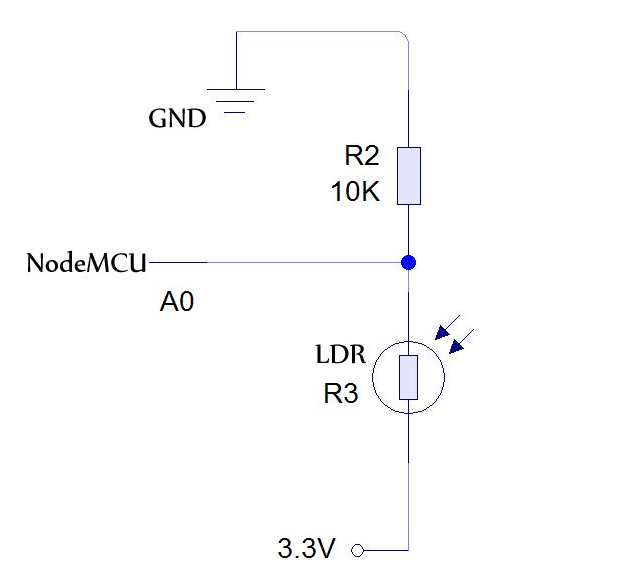
It behave same like photoresistor.
It works as variable resistance that depends on the intensity of light, if the intensity of light is more than it gives less resistance and if light intensity is less then resistance produced by it is more...means resistance of LDR and light intensity are inversely proportional to each other.
The graph between resistance and light intensity is exponential graph
NodeMCU is one of the most popular IoT Development platform use by the thousands of developers worldwide. What is more attractive is that it can run on the even more popular Arduino IDE.
NodeMCU alone is able to connect and send the data to cloud that makes it more preferable(no need to have bunch of boards, only one is enough).
The goal of this tutorial is to enable you to send capture and send data to cloud from your NodeMCU device. Before starting this tutorial make sure you have your NodeMCU and lm35 sensor handy.
Part I: Installation and Settings of Arduino IDEOnce you download and install the arduino ide, to get start with ide it is good to check this first (http://www.circuitbasics.com/arduino-basics-installing-software).
Part II: Setting Up Cloud Account on ThingsIO.AIThingsIO.AI is a IoT platform for developers. As a developer we understood the pain of not having a seamless place to connect, analyze and process device data. Many pure analytics platforms does not offer device management, which is core for the iot. That is the reason for ThingsIO.AI.
- Register the account in http://thingsio.ai/#/register.
- You will get the notification for sign up.
- Go in your email address and verify your account.
- After that, sign in your account with your email address and password
- Now, you will be on the project dashboard. Click on the new project option.
- Click on the add a new device option. You will get device ID.
- Enter the device name and click on the create and configure device.
- You will be on your device dashboard.
Some basic points(1-5) for analysing data on ThingsIO.AI
1. Track your device’s special parameters here. This can be set in device configuration(default to null).
2. You can see your real time and special parameter’s graph.
3. You can see your all data points.
4. You can see here your last 5 data points.
5. You can see here all the list of created graphs.
- Go in sample device code options and click on the NodeMCU.
- You will get the sample code from there copy and paste into your Arduino IDE.
Click on the “Send trial data” to send a trial data to the server:
Part III: Setting Up NodeMCUwe have already made hardware connection so just upload this code on nodemcu by using an usb. and open your serial monitor where you see the values of temperature in different units.
- one important thing while uploading the code, check the device id.
Part IV: Charting and Visualizations on ThingsIO.AIGo to your ThingsIO.AI account and go to your device ->
Click on the configuration device option:
- You can set the special parameters (this is tracked on the device dashboard) & transform it accordingly and add new parameters (Parameters are updated automatically as you send them from your device).
- Click on the update device option:
- To create a graph for your device click on the “create graph option."
- Put the parameter that you want in your graph.
- And you will be having the graph of your data.
.


Comments
Please log in or sign up to comment.