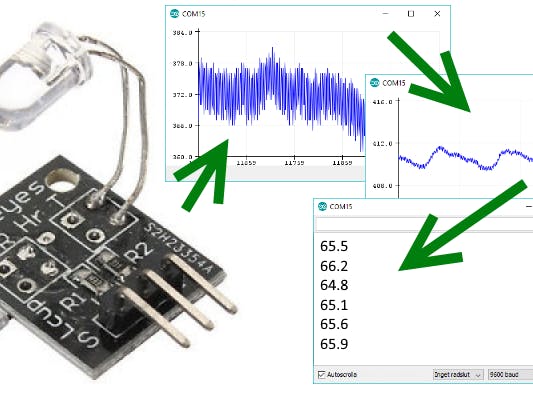
In the set of 37 sensors for Arduino, there's a heartbeat sensor. The name promises too much. People tend to think it provides a digital number through I2C or something similar, a number which is the heartbeat rate. What the sensor provides is just an "analog" value from 0 to 1023, telling how much infra red light the light sensor receives, or actually how much something is shading the light sensor. The higher value, the less infra red light.
In short: place your finger between the IR led and the light transistor of the sensor. Your heartbeat dilates the blood vessels in your finger, which will filter the IR. This creates a pulsating signal.
In this project I describe how this signal is converted into a heartbeat rate like 66 BPM (beats per minute).
The simple stepsIf you just read and plot the values from the KY-039 sensor, you get something like this:
The values are integer values. Not very accurate. Instead calculate an average of a bunch of them and plot the average. You get this:
Here you can already see the pulse of the heart. Get the time difference between each significant rise of the pulse. From that you can calculate the heart rate in BPM.
(The small zig zag pattern in the image above is due to artificial light, 50 Hz, another thing one has to deal with.)
Steps explainedHere's some simple code to just output whatever you read from the KY-039 sensor:
// Pulse Monitor Test Script
int sensorPin = 0;
void setup() {
   Serial.begin(9600);
}
void loop ()
{
   while(1)
   {
     Serial.print(analogRead(sensorPin));
     Serial.print('\n');
   }
}
What you might get is something like this:
Since this is a caption from the serial monitor window reading the serial output from your Arduino at 9600 baud, the whole process gets timed by the Serial.print() function, which will set a rate for reading and plotting the values. Anyway, the curve is very jagged, because it varies between 360 and 383 and has only integer values.
To get a smoother output , take an average of say 20 last readings from the sensor. Here's how I do it. I define a constant telling how many readings I want:
#define samp_siz 20
Then I have an array holding that number of readings:
int reads[samp_siz];
For each new reading I subtract the oldest reading from a sum and add the newest reading to the sum. In the array I replace the oldest reading with the newest reading.
     reader = analogRead (sensorPin); // read the sensor
     sum -= reads[ptr];               // subtract the oldest reading from sum
     sum += reader;                   // add the newest reading to the sum
     reads[ptr] = reader;             // save the newest reading in the array
     last = float(sum) / samp_siz;    // calculate the average now
     ptr++;                           // update the index for the array, have
     ptr %= samp_siz;                 // it restart at 0 when needed
With an array size of 20 and a baud rate of 9600 in the serial monitor, I might get a plotting like this:
Here you see the actual heart beats as a steep rising curve. But you see also a small zig zag pattern. The smaller zig zag comes from my kitchen light, three LED bulbs lighting the room. The mains in my house is 240 V, 50 Hz AC. So 50 times per second there's a rise of light intensity, apparently also in the IR band. I'd like to smooth out that 50 Hz noise. It should work, if I read values from the sensor during a 20 ms period and take an average of all values. Let's see...
     n = 0;
     start = millis();
     reader = 0.;
     do
     {
       reader += analogRead (sensorPin); // read and add values...
       n++;
       now = millis();
     }
     while (now < start + 20);           // ...until 20 ms have elapsed
     reader /= n;                        // and take an average of the values
With this snippet I take the sensor readings in 20 ms chunks, which will even out the 50 Hz flickering caused by artificial light. If you live in a country with 60 Hz, use 16.67 ms chunks instead. Or 16667µs.
Since I already smooth out the curve in 20 ms sections, I don't actually need the array I used earlier, but since it's there and it's easily resizable, I leave it there. And using an array size of 5 seems to even out the last annoying noise. This is what I have now:
Last thing I need to do is to recognise any part in the repeating pattern. Since the rising slope is more regular, I go for it. Notice how the y-axis values are very different in all the graphs. I really can't just rely on absolute values. I can only rely on the rising and falling of the curve. Mathematicians would talk about the derivative. I'm satisfied if I find n consecutive rising values, where n could be a handy adjustable value. I start with 5. For this i have the rise_threshold constant defined in the code. When I find 5 consecutive rising values, I know I'm at the bottom of the curve heading up. I take time. I wait for a falling curve, then I wait for next 5 rising values and note the time. Then I print the corresponding BPM.
I did a test and counted how many consecutive rising values there are in the curve and found out there were between 10 and 15. So if I count to 5, I will most sure know I've found the start of the heartbeat.
Since I print only after each heartbeat, there won't be much printing. There will be more time for reading the sensor. I might catch more high frequent noise, which I won't see, because the plotter is not on. Let's see how it works.
The final code#define samp_siz 4
#define rise_threshold 5
// Pulse Monitor Test Script
int sensorPin = 0;
void setup() {
Serial.begin(9600);
}
void loop ()
{
float reads[samp_siz], sum;
long int now, ptr;
float last, reader, start;
float first, second, third, before, print_value;
bool rising;
int rise_count;
int n;
long int last_beat;
for (int i = 0; i < samp_siz; i++)
reads[i] = 0;
sum = 0;
ptr = 0;
while(1)
{
// calculate an average of the sensor
// during a 20 ms period (this will eliminate
// the 50 Hz noise caused by electric light
n = 0;
start = millis();
reader = 0.;
do
{
reader += analogRead (sensorPin);
n++;
now = millis();
}
while (now < start + 20);
reader /= n; // we got an average
// Add the newest measurement to an array
// and subtract the oldest measurement from the array
// to maintain a sum of last measurements
sum -= reads[ptr];
sum += reader;
reads[ptr] = reader;
last = sum / samp_siz;
// now last holds the average of the values in the array
// check for a rising curve (= a heart beat)
if (last > before)
{
rise_count++;
if (!rising && rise_count > rise_threshold)
{
// Ok, we have detected a rising curve, which implies a heartbeat.
// Record the time since last beat, keep track of the two previous
// times (first, second, third) to get a weighed average.
// The rising flag prevents us from detecting the same rise
// more than once.
rising = true;
first = millis() - last_beat;
last_beat = millis();
// Calculate the weighed average of heartbeat rate
// according to the three last beats
print_value = 60000. / (0.4 * first + 0.3 * second + 0.3 * third);
Serial.print(print_value);
Serial.print('\n');
third = second;
second = first;
}
}
else
{
// Ok, the curve is falling
rising = false;
rise_count = 0;
}
before = last;
ptr++;
ptr %= samp_siz;
}
}
It works pretty good. Here's a video.
Note that the tiny RX led flashes on the Arduino in sync with my heart. Simply because when there's a heartbeat, the rate is calculated and printed to the serial, which flashes the led. When finger moves a little, there will be error readings.
Further developmentRight now the printed rate is calculated based on the last three beats. But it could be more appropriate to calculate it based on say a 15 s period. I could save 15 consecutive rate values, calculate the mean, then leave out the five values that are farthest from the mean and calculate a new mean. This would pretty much give a reliable and steady measurement of the heart rate.
I've only tested the sensor on my wife and on me. Each step in enhancing the signal I have made based on the previous readings. Someone else might have another kind of heartbeat causing a different shaped curve, which needs another approach for finding the beat. Maybe it's the falling curve that is easier to recognise. Or the very top. And what happens if the pulse is 180 - 200 BPM? Finding the rising curve might be trickier.


_ztBMuBhMHo.jpg?auto=compress%2Cformat&w=48&h=48&fit=fill&bg=ffffff)


Comments
Please log in or sign up to comment.