


Hardware components | ||||||
 |
| × | 5 | |||
| × | 1 | ||||
 |
| × | 1 | |||
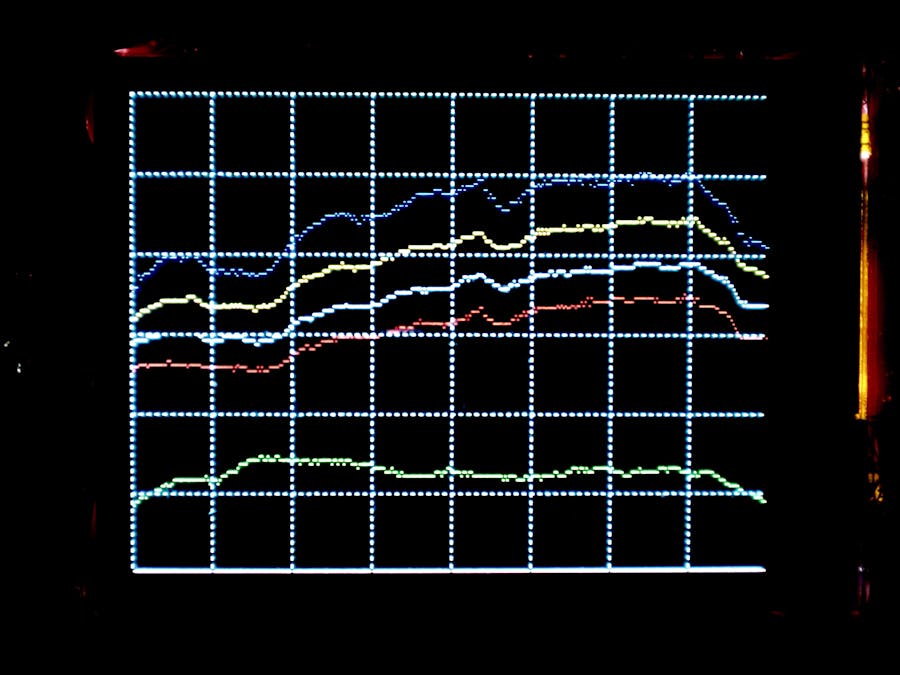
When I started reading the temperatures at different places, I realized that the results were a bit faulty. That was the reason for me to select sensors that gave the same or at least similar values. I did not like to compare long lists of figures, that is why I used the plotter of the old ARDUINO IDE:
By the way, if you perform continuously readings, the DS18B20 will heat up over the time. After some 75 readings, its internal temperature will increase by nearly 0.25 degrees Celsius. There were long pauses between the sequences of reading:
But at the end, I wanted to run it without a computer, so I got me a TFT LCD to show the results. I went for a 2.4" 320 x 240 display shield using an 8-bit parallel interface, knowing there are some drawbacks of this type. Its touch-screen is not very reliable, and the interface consumes most of the Arduino pins, leaving only a few to connect the sensors. But the set of DALLAS DS18B20 only requires one single pin for all of them. Another drawback is the libraries you need. I found many libraries that did not work at all. The KBV (MCUFRIEND) did its job even very fast and supports a zoo of driver chips (that I do not own), but I was not happy with their function names, for instance this is the command for placing the text cursor:
mylcd.Set_Text_Cousur(0, 0);(Is there any language world-wide that contains a word like cousor?) Libraries like that should not pass the auditions.
Anyway, the Adafruit naming conventions suit me much better, but I have not been able to get their libraries working. So, at the end of the day I started to write a library of my own and even managed to support the new ARDUINO UNO R4 what the other libraries don't.
In the picture shown above you see five graphs recorded simultaneously at the same place, but obviously the data given by one of them are very different from the data of all the others. As I had a box full of DS18B20, I started to select one which gave the same results as the others.
The disadvantage of using the shield version is you have no access to the pins any more. Fortunately, some clones come with an extra layout: they offer the Serial pins, the I2C pins, and some extra power pins between the ICSP and the analog pins:
So it is easy to mount a small stripboard to carry the sensors to this pins. Some capacitors improve the stability. If your ARDUINO UNO is not equipped with these extra pins, you have to insert a shield like this in between:
Shields to give access to all the pins can be constructed easily using these components:
My initial aim was to connect as many sensors as possible and show as many samples as the width of the TFT LCD by just using an ARDUINO UNO R3. This was possibly only by storing the y-positions of the samples as byte values rather than float (4 bytes each). But when I tried autoscaling, I had to adjust all previous y-position when setting the new scale. And that was the end, I was reaching the limits of the R3 version and had to use the new MINIMA. The problem with R4 is you do no longer have any output PORTs, that makes setting pixels much slower. Especially clearing the screen is four times slower than using the R3 (despite running at 48 MHz).
At the end of the loop function of the sketch in the attachments you will find this line
//while (millis() < t);If you uncomment this line, the x-axis will be streched to show values samples during the last hour, that is why tickmarks show 10 to 60.
The schematics is more than simple: the TFT shield only leaves pin A5 free to use, so this will be the data input for all the DS18B20. Do not forget to connect a 4.7 kOhms resistor from this input to Vcc.
More attachments coming soon.


Comments
Please log in or sign up to comment.