


Hardware components | ||||||
_ztBMuBhMHo.jpg?auto=compress%2Cformat&w=48&h=48&fit=fill&bg=ffffff) |
| × | 2 | |||
| × | 2 | ||||
 |
| × | 1 | |||
 |
| × | 4 | |||
 |
| × | 2 | |||
 |
| × | 2 | |||
 |
| × | 2 | |||
| × | 1 | ||||
| × | 1 | ||||
Hand tools and fabrication machines | ||||||
 |
| |||||
Some readers complained about the length of this article, and they were right. But instead of shortening it, I wrote a new one which can be read in minutes:
https://www.hackster.io/Klausj/doppler-effect-made-easy-8913ea
IntroductionOn daily basis we are getting news of discoveries of galaxies far away, and nearly all of them are moving away from us at high speeds. When we compare the colour of their light to that of our sun all colours appear to be shifted towards red which enables scientists to measdasdasure their speed of movement.
As it is difficult to handle frequencies of light waves in class it is much easier to do it with sound waves.
The primary goal of this project is to support teaching of the acoustical Doppler Effect in secondary grades. There are plenty of good articles on the complete theory and a lot of commercial components to demonstrate this effect, but they are expensive, complex, not easy to use and not widely available.
The effect can be observed easily when fast cars are passing by but it is not safe to have such high speeds in a classroom.
Some students might ask: What is the minimum speed at which the Doppler Effect will show up?
The better question would be: What is the minimum speed at which it can be detected?
What are really slow speeds?
If math is not your favourite subject skip the theory and have a look at the scenario shown at the very end of this article.
The TheoryThis is the well-known formula for the observed frequency:
where S is the sender, O is the observer, vO, vS and c are the speeds.
The frequency shift can be found easily as the difference of those frequencies:
for very small values of vO and the sender kept stationary.
At very slow speeds it makes no difference which of them is moving.
As can be seen in the formula the frequency shift increases with the frequency of the sound signal and the speed. So if you want to achieve a difference which is not too small to observe even at low speeds you have to use high frequencies, the best obviously are inaudible high tones. There are two advantages using ultrasonic: if you were using audible sound, the receiver might be triggered by any noises produced by your students, and further more your students will not suffer from sounds they do not perceive.
It can be done with the standard equipment available at many schools and physics departments at universities as shown here see slide #3.
What precision can be obtained?When you keep counting for one second (the gate time) the error will be 1 Hz. You might miss one wave at either end of the interval. There are ways to increase the precision using a method called reciprocal counting.
All Arduinos are equalbut some Arduinos are more equal than others:
In the theory chapter you saw that a constant frequency is most important. So it is recommended to use Arduinos with a crystal because ceramic ones tend to drift alot. The kind of chip PDIP-28 (left) or TQFP (right) does not matter.
How to get the transducersTransmitters and receivers for ultrasonic sound are available at many distributors but I decided to dismantle one of the HC-SR04 modules which are intended for distance measurement by echo technique.
Do not forget to mark sender (S) and receiver (R). These ultrasonic transducers operate only in a small range at some 41 kHz.
The TransmitterTo produce the ultrasonic sound a simple crystal with a frequency divider would do. In this project I used an Arduino which enables to generate different frequencies. There is a button to switch to the next frequency.
I also used the MAX-232 circuit to amplify the volume of the generated sound. The MAX-232 was designed to convert the standard voltage of 5 volts to +10 volts and -10 volts for usage in serial communications.
The button on the prototype board is connected to pin 10.
If you don't like soldering it also can be done on a breadboard.
The ReceiverIn the receiver, the small signal produced by the transceiver has to be amplified. I used the TLC-2262 which is a rail-to-rail opamp that can drive the Arduino count input pin-5 (also called T1) directly.
If you try it with the common LM358 you only get some results when transmitter and receiver are very, very close to each other.
To read the frequency, I used a library provided by Paul Stoffregen. The results could be presented in the Arduino Serial plotter like this:
But it would be better if the device could be used without using a computer. So I added a small TFT-1.8” display to watch the frequency shift while either sender or receiver is moving. The TFT is connected to pins 8 to 13 (SPI) as usual. The TFT library is shipped with the Arduino IDE, no need to download anything.
What to do if it does not work?As you can neither see nor hear ultrasonic waves there must be a way to find a fault. And there is a very easy one, provided you find a CMOS CD4060 in your box. It will trigger on small pulses sent from the US receiver, perform a frequency division by 2^14 and drive an LED with 2.5 Hz.
The distance should be less than 5 centimeters (two inches).
You can use single LEDs or one of the modules that contain a set of six, equipped with the resistors. If the LEDs do not flash there must be a failure inside the sender.
How to operate it allYou have to power both devices with 5 volts. It can be done with any USB port. You might consider using power banks for it. But be aware most power banks will cut off when the consumption is too low, and this could happen. So better use a mains adapter or power it from a PC.
Unfortunately, even when both devices are kept stationary it is quite normal that the value of the frequency shown on the display does not appear stable but the least significant bit will fluctuate for example constantly changing back and forth between 40999 and 41000 Hz.
You can try to minimize this by selecting another frequency at the transmitter. A reliable value can not be given as the frequencies of the crystals built-in into Arduinos never will match the 16 MHz as on the lable but will differ by some 1000 Hz.
The software for the receiver assumes the first value received when both devices are not moving and will plot dots on the x-axis. The two auxiliary lines are drawn at 10 Hz above and below this frequency. Dots plotted at those lines would indicate a speed of 0.0837 m/s. As you can see in the pictures, much slower speeds can be detected.
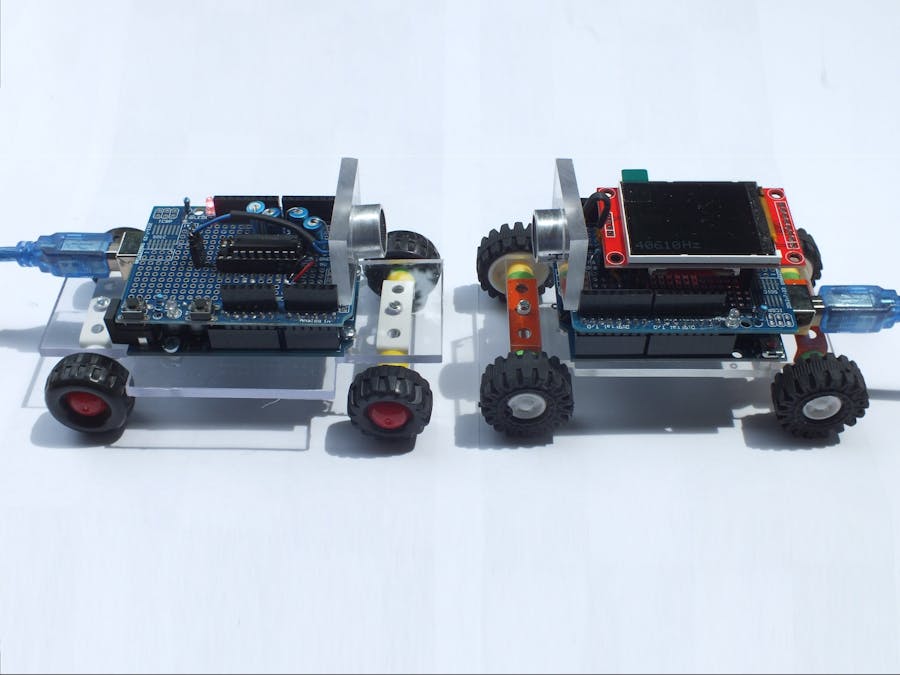
To ease the moving of the devices they were mounted on some wheels which are included in toy construction kits.
The volume of the sound is very powerful and can be detected in a distance of up to ten meters.
The picture clearly shows at first the received frequency increased, then the frequency decreased. So at first the devices approached each other, then they went back.
This is a close-up of Fig. 4. You clearly can see the value of the frequency toggled between 40609 and 40610 Hz when neither of them are moving.
Now we selected a frequency which did not lead to any toggle. After changing the frequency at the transmitter you have to press RESET at the receiver to set the new center frequency.
As the graph crossed the 10 Hz-lines the speed was slightly above 8 cm/s.
If you want to avoid the stress of wheels, how do you create slow, steady movement? Use the ancient Egyptian method, but instead of the tree trunks use broken spaghetti.
If some students do not trust what is displayed on the screen, simply press the button on the transmitter (connection between pin-10 and Ground) to switch to the next US frequency, and it will be displayed on the receiver immedialtely as explained above. To get the proper diagram you have to reset the receiver by interrupting the power supply in order to set the new center frequency.
ModificationsWhen I checked the compiler output it turned out that less than a quarter of the flash memory of the ARDUINO UNO was used. So, the predecessor chip which is the ATmega8 would fit. Long time ago, there was the Arduino-NG which was built using the ATmega8. The chip is still available and somewhat cheaper than the current ATmega328. That is why I redesigned the whole thing, omitting the Arduinos and using breadboards to place the controller and the amplifier chips.
The frequency counter can be implemented much easier as a 16-bit counter will never overflow counting up to 41.000 so no library has to be used.
There are different options to upload the modified software to an ATmega8. I recommend using an Arduino UNO with a replaceable PDIP-28 chip, remove it and place the ATmega8 in it. When all the work is done you can extract the ATmega8 and insert it in the breadboard. Don’t forget: you have to do this for both, the transmitter and the receiver.
In order to transfer the sketches there are two options: if you are a well equipped professional you can upload using an ISP programmer, otherwise you need the bootloader. You can go to Tools-->Board select “Arduino AVR Boards” --> “Arduino NG or older” and in Tools-->Processor select ATmega8. Unfortunately, it must be said, for technical reasons that bootloader causes a long delay before starting the program. You better go for the “Atmega8A Fastboot” bootloader which does not cause such a delay. At first, you will have to burn the bootloader. There are many websites giving instructions how this can be done. When finished, you can upload the new software for transmitter and receiver. Fix labels on the chips not to get mixed up.
Actually, you can also use the modified design with ATmega328 instead of ATmega8 which makes programming much easier.
As I did no longer use the ARDUINO UNO, all parts fit into a gift box with 8.5 cm * 4.8 cm inner size. (The schematics are still the same.) So the new bill of materials changed:
replace:
- each ARDUINO UNO byte an ATmega8 plus crystal and two 22pf capacitors and an LED plus resistor
- each prototype board by a wooden box (or any other enclosure) plus two breadboards
add:
8-pin header to lift the TFT up from the breadboard
USB mini connector
use:
second software package.
You need to carefully drill holes of 16 mm for the US transducers create a slot for the USB connector.
If you are not willing to dismantle it after use and keep it for future classes you can mount everything on a PCB (printed circiut board) like this:
As you probably know, in medicine diagnostics X-rays have been replaced by ultrasonic, wherever possible. For the human auditory system inaudible sounds normally are no risc (opposite to the visual system where infrared and ultraviolet can cause some damage). Some of your pets might hear ultrasonic but probably not 41 kHz. For sure, bats are able to hear it, so please do not use the device when and where bats fly around.
Ultrasound may be able to keep or chase away certain pests and vermin, but I wouldn't rely on that.
Doppler Effect without Math1.) Red shiftTry to imagine the following situation which does not claim to be a realistic one:
There is an explorer crossing the Sahara at a speed of 10 miles per day. To keep in contact his hometown is sending him messages by carrier pigeons each day (cell phones don’t work in the desert). The pigeons fly at a speed of 20 miles per day. So, without being an expert of math you could get this table:
And, as you can easily see, pigeons are sent day by day, but the explorer receives a carrier pigeon only every second day.
Expressed in terms of frequency, the sender (of the pigeons) has a frequency of 1 per day, but the receiver gets a frequency of 1 per every two days equal to 0.5 per day.
Exercise:
On his way back (same speeds) what would be the frequency of meeting the carrier pigeons? Would it be 1 or 1.5 or 2 or anything else?
2.) Blue shiftWait a minute, please Mister Postman - Doppler effect for beginners
Even less realistic, but more easy to understand
Let us assume there is a post office that has an infinite number of postmen and sends out one ot them every 10 minutes. Each postman has (among other things) a letter for a recipient named R. So R will receive one letter every 10 minutes.
At one time R decides to set off in the direction of the post office (same speed as all the postmen). After only 5 minutes he will meet a postman who would normally arrive at R's house just 5 minutes later, and the postman will hand him a letter. After another 5 minutes he will meet the next postman, and so on. So R receives a letter every 5 minutes until he reaches the post office.
(Avoid letting R going in the opposite direction.)
Conclusions.
Once you have followed this, it will be easy to understand Albert Einstein’s General Theory of Relativity. Just replace the ways taken by the universe and the pigeons or letters by the light sent by galaxies far away from us. It is quite obvious that the messages (photons) sent by them have to appear red-shifted.


_3u05Tpwasz.png?auto=compress%2Cformat&w=40&h=40&fit=fillmax&bg=fff&dpr=2)
Comments
Please log in or sign up to comment.