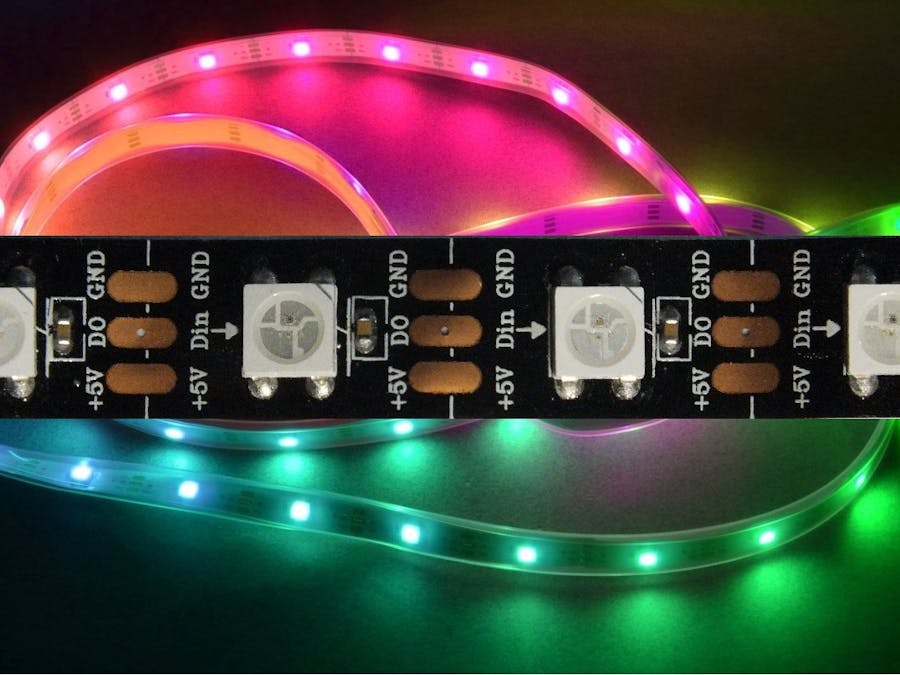
Fans of WS2812 strips are happy as soon as their application works as intended. But do they ever check how things work internally? This is to show a way how to analyze the transmission of data using a minimum of additional components.
We are using the common strips offering 60 LEDs each. First of all, you need one Arduino (called sender) to produce a string of data to be sent to strip-1. Obviously, it is not easy to connect jumper wires to the small copper parts between adjacent LEDs.
So, we simply will use several strips, which offers an easy access to the connections between them.
The power lines are not shown in this schematic. Obviously, the GND of both Arduinos have to be connected. Only one of them provides +5Vcc to the strips.
The outgoing data produced by the sender (using pin A0) as well as the data fed from the last LED of strip-1 to the first LED of strip-2 and the data fed from the last LED of strip-2 to the first LED of strip-3 and (if available) the outgoing data of strip-3 are sampled by a second Arduino (called analyzer) using pins 8, 9, 10 and 11, all belonging to the same port (Port B in this case) which makes sampling much easier and faster.
The job of the analyzer program is to wait for the start of the stream of data, then sample as much as the Serial Plotter can hold (500 samples) and finally present the data. This program can also measure the time to read these 500 samples.
This plot has to be explained. the series drawn in blue show the stream of data sent by the sender to the first LED of strip-1. The series drawn in red shows the data transmitted from strip-1 to strip-2, the series drawn in green shows the data transmitted from strip-2 to strip-3. (The output of strip-3 is not shown here.)
The senders sketch shows
int NUMPIXELS = 180;So, data are sent to all of the 3 x 60 = 180 LEDs. As there is no LED #181, the LED #180 has no data to pass, and there won't be any output at the end of strip-3. If you want to see some pulses at this point you have to set NUMPIXELS = 181 (or even more).
The headline indicates: the total time to read 500 samples took 5724 microseconds. When you measure the three intervals you get 1800 microseconds for each of them. Now you can do the math: 3 colors x 8 bits x 60 LEDs = 1440 bits to be sent for each strip. If you divide this by 1800 microseconds you get the frequency of 800000 Hertz which corresponds exactly to the data sheet of the WS2812 LEDs.
Why do I need a second Arduino to analyze the signal?This is a legitimate question as everybody knows microprocessors can perform multitasking using their interrupts. But while sending data to the strip interrupts have to be disabled completely. The transmission of the data is extremely fast. To check this I set the number of LEDs to more than 300 while there were only 60 LEDs on the strip, hoping Arduino might see some of the data being sent to non-existing LEDs. Using a scope you can watch the superfluous pulses:
(The scope used here is an ancient 10MHz HAMEG scope, you probably have a better one.)
Even when you set the number of LEDs just one higher than the actual number of LEDs you can count 24 (= 3 x 8) pulses destined for LED #61.
If you want to play with things like this here is some code to analyze the signals.
/*
  Programm to check the signal via scope.
  The Serial Plotter only shows zeroes..
*/

#include <Adafruit_NeoPixel.h>
byte p = A0;
int N1 = 61; // 365;// max. value with UNO
Adafruit_NeoPixel s = Adafruit_NeoPixel(N1, p, NEO_GRB + NEO_KHZ800);
/*
  The LED strip used has only 60 LEDs.
  The commands for the non-existent N1-60 LEDs
  are available at the end of the strip. They
  can be shown using a scope but not with Arduino.
*/
const int N2 = 500;
byte a[N2];
int q = A5;

void setup() {
  Serial.begin(9600);
  Serial.println(__FILE__);
  s.begin();
  s.setPixelColor(4, 12345);
  s.setPixelColor(59, 1234567);
}

void loop() {
  s.show();
  /*
    // read as fast as you can:
    for (int i = 0; i < N2; i++) a[i] = digitalRead(q);
    for (int i = 0; i < N2; i++) Serial.println(a[i]);
  */
}
Have fun!


_ztBMuBhMHo.jpg?auto=compress%2Cformat&w=48&h=48&fit=fill&bg=ffffff)


Comments
Please log in or sign up to comment.