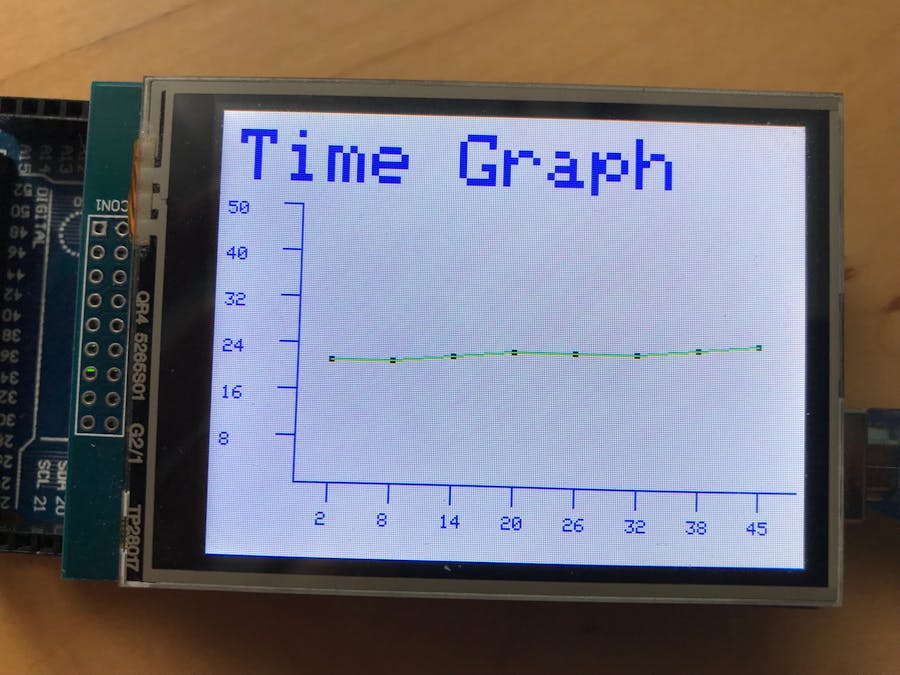
Have you ever wanted to graph your data professionally on a TFT LCD? But there is a problem, it is particularly difficult to create a graph because of all the calculations involved.
This project aims to lift all of that stress off your shoulders and allow you to create your own personalised history graph, graphing anything you want in just seconds. All you have to do is edit 5 variables.
Video
Image
This project aims to make graphing easy and fun for everyone, all the hard calculations are completed, all the user has to do is edit 2 variables, and choose the colour for their graph. Here are some examples showing the diversity of the graph.
The graph will plot the temperature live, at intervals of 6 seconds, the value will be displayed by a dot, the dot will be connected to other dots by a line. The seconds that passed since the start of the code will be displayed on the x axis with the range of the values on the y axis.
The project works simply, the Arduino Mega reads the value of the DHT 11 sensor and stores the temperature to a variable, it then graphs the value on the customised graph. Here is a diagram illustrating the functionality overview.
Here is an image showing the project's code overview.
Read Temperaturewill read the temperature from the sensor
Process Datawill process the sensor reading and map it to the graph.
Graph Datawill display the mapped values on the graph.
All you have to know to be able to proceed with this project is a broad understanding onto how things are positioned on the TFT LCD, this is explained below.
I refer to the whole LCD as the canvas, this is where everything is drawn, all TFT LCD libraries work quite similarly, so the functions in this code should also work with other libraries. Below is a sketch of a quadrilateral (a rectangle) being drawn on a TFT LCD.
In this sketch, a rectangle is drawn, each point is labelled, the line of code that is used to draw a rectangle is this,
tft.fillRect(originX, originY, sizeX, sizeY, Colour);
originXis represented by 'z' on the diagram above, this is the distance from the right of the screen to the shape.
originYis represented by 'x' on the sketch, this is the distance form the top of the screen to the shape.
sizeXis the size of the shape on the x axis, this is the length of the shape.
sizeYis the size of the shape on the y axis, this is the height of the shape.
The user operating this project will benefit In:
- Graph sensor data on a TFT LCD
- Do so in seconds
Step 1: Required Apparatus
This project is using a DHT 11 temperature and humidity sensor to receive the temperature data, but any sensor can be used, changing the sensor will be explained further down.
- 1, Arduino Mega
- 1, Breadboard
- Jumper Wires
Step 2: Connecting the Circuit
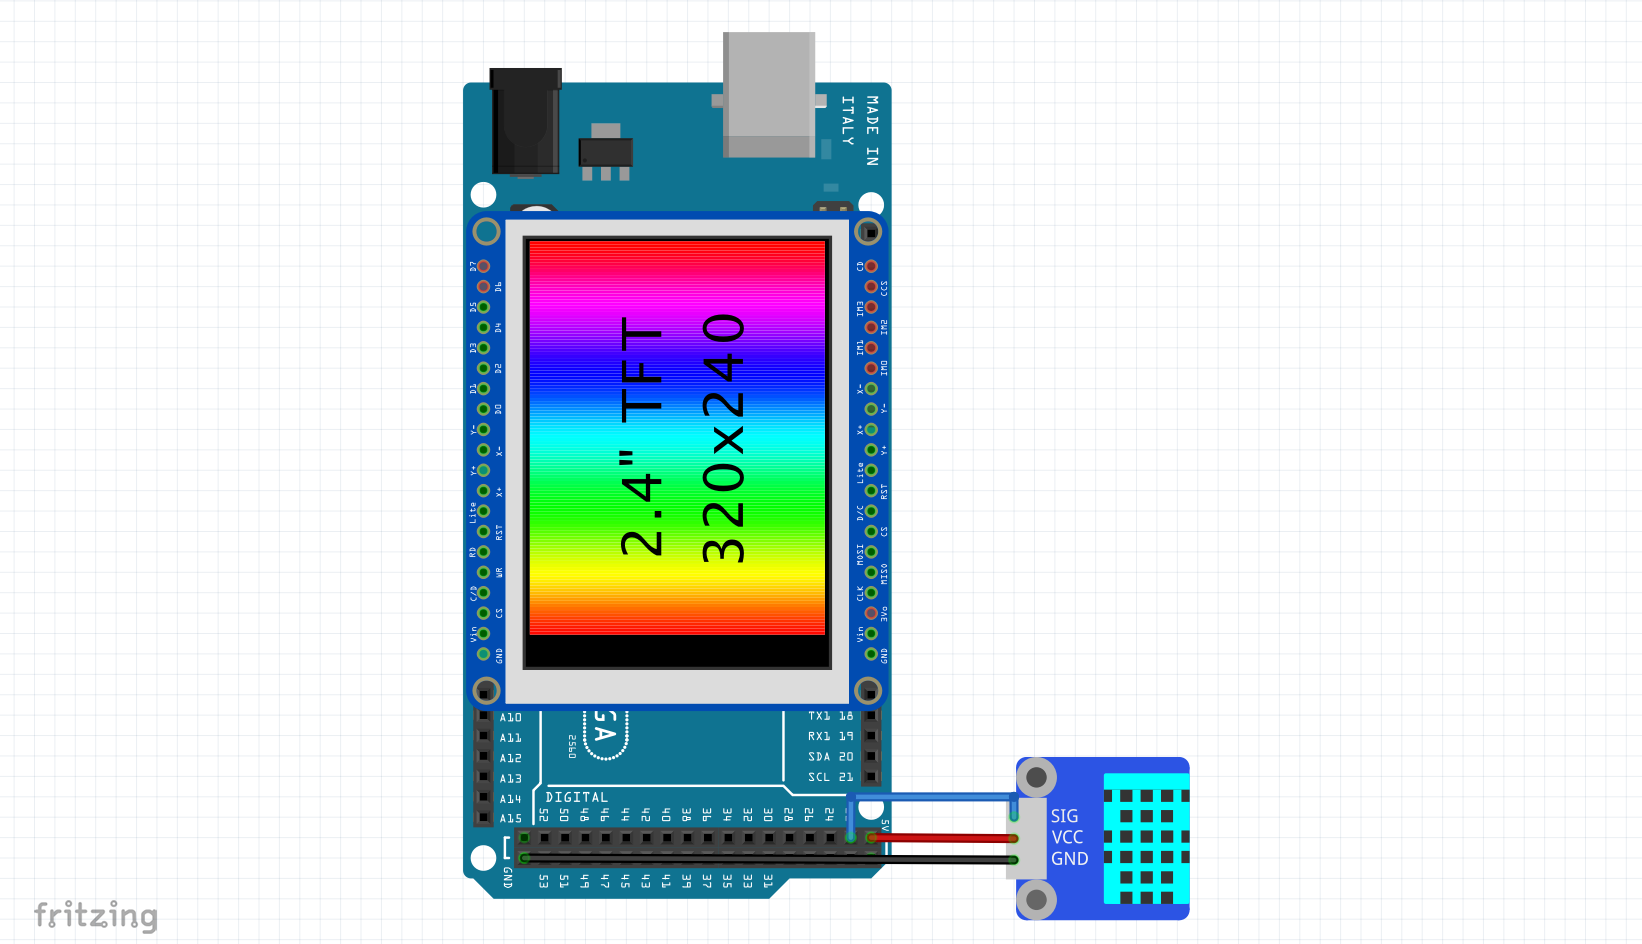
Here are the schematics for the project, just attach the DHT 11 sensor to the Arduino Mega and you are good to go.
Step 3: Acknowledging the Code
There are 3 main parts to the code:
- Set Up Graph
- Read Temperature
- Draw Graph
These sections are explained below.
- Set Up Graph
// draw title
 tft.setCursor(10, 10); // set the cursor
 tft.setTextColor(BLUE); // set the colour of the text
 tft.setTextSize(4); // set the size of the text
 tft.println(graphName);
 // draw outline
 tft.drawLine(originX, originY, (originX + sizeX), originY, graphColor);
 tft.drawLine(originX, originY, originX, (originY - sizeY), graphColor);
 // draw lables
 for(int i = 0; i < numberOfMarks; i++)
 {
   tft.drawLine(mark[i], originY, mark[i], minorSizeY, graphColor);
 }
 // draw numbers
 for(int i = 0; i < 6; i++)
 {
   tft.drawLine(originX, (originY - number[i]), minorSizeX, (originY - number[i]), graphColor);
 }
 // draw number values
 for(int i = 0; i < 6; i++)
 {
   tft.setCursor((minorSizeX - 30), (number[i] + numberSize));
   tft.setTextColor(graphColor);
   tft.setTextSize(1);
   tft.println(val[i]);
 }
This part of the code will draw the outline of the graph, it will draw the x and y axis lines, it will also draw the marks and will label the y axis with values.
- Read Temperature
chk = DHT.read11(22);
 temp = (DHT.temperature);
This short line of code will read the temperature form the DHT 11 sensor and will then store it in a variable.
- Draw Graph
if(blockPos < 8)
 {
   // print the time
   tft.setCursor((mark[valuePos] - 5), (originY + 16));
   tft.setTextColor(graphColor, WHITE);
   tft.setTextSize(1);
   tft.println(timeBlock[valuePos]);
   // map the value
   locationBlock[valuePos] = map(temp, 0, graphRange, originY, (originY - sizeY));
   // draw point
   tft.fillRect((mark[valuePos] - 1), (locationBlock[valuePos] - 1), markSize, markSize, pointColor);
   // try connecting to previous point
   if(valuePos != 0)
   {
     tft.drawLine(mark[valuePos], locationBlock[valuePos], mark[(valuePos - 1)], locationBlock[(valuePos - 1)], lineColor);
   }
   blockPos++;
 }
 else
 {
   // clear the graph's canvas
   tft.fillRect((originX + 2), (originY - sizeY), sizeX, sizeY, WHITE);
   // map the value - current point
   locationBlock[valuePos] = map(temp, 0, graphRange, originY, (originY - sizeY));
   // draw point - current point
   tft.fillRect((mark[7]), (locationBlock[valuePos] - 1), markSize, markSize, pointColor);
   // draw all points
   for(int i = 0; i < 8; i++)
   {
     tft.fillRect((mark[(blockPos - (i + 1))] - 1), (locationBlock[(valuePos - i)] - 1), markSize, markSize, pointColor);
   }
   // draw all the lines
   for(int i = 0; i < 7; i++)
   {
     tft.drawLine(mark[blockPos - (i + 1)], locationBlock[valuePos - i], mark[blockPos - (i + 2)], locationBlock[valuePos - (i + 1)], lineColor);
   }
   // change time lables
   for(int i = 0; i <= 8; i++)
   {
     tft.setCursor((mark[(blockPos - i)] - 5), (originY + 16));
     tft.setTextColor(graphColor, WHITE);
     tft.setTextSize(1);
     tft.println(timeBlock[valuePos - i]);
   }
 }
 valuePos++;
This long part of code will draw the points of the graph at their values and then will join them through lines, the code checks if the canvas of the graph is filled up, if it is, it will start ejecting the first value of the graph and moving the others up to allow space for the new value to be inserted, if there is still space left, the device will keep adding values at intervals.
Personalising the Graph
The fun thing about this graph is that it is 100% editable, so the user can edit the size of the graph, its location and its colour, the user can also display any data on the graph thanks to its flexibility. Are are all the variables you should care about.
bool proDebug = 0;
 uint16_t graphColor = BLUE;
 uint16_t pointColor = BLACK;
 uint16_t lineColor = GREEN;
 String graphName = "Time Graph";
 int graphRange = 50;
 int markSize = 3;
proDebugis the debugging utility built into the project, it is set to 0 as default, when set to 1/true, it will print the current temperature to the Serial Monitor, this is a debugging utility, note that if enabled, the Serial Monitor is required to be open for the code to run.
graphColorsets the colour of the graph, the x and y lines and their labels are set to this colour.
pointColourrepresents the colour of the point illustrating the value on the graph.
lineColoursets the colour of the line joining the dots on the graph to the colour selected.
graphRangeis the backbone of the graph, note that it is really important that it is set correctly, it represents the max value that can be graphed, I am using a temperature sensor, I would not expect the value to exceed 50ºC, so I set the value to 50, if you want to graph a Raw analog input, you can set the graphRange to 1024, the max value that an analog pin can display.
markSizerepresents the size of the point labelling the value of the sensor on the graph, the value represents the length of the square.
And that is it, it is all that you have to worry about, the remainder of the variables will be figured out automatically by the Arduino.
Changing the Value
It is nice to graph the temperature in your room, but it is even better if you could display any sensor data on the graph, and you can, by just editing a few lines of code, you could graph any data from soil moisture to light intensity. Here is a guide to doing so.
Going Further
You can go further experimenting with the project, try editing the originX, originY, sizeX and sizeY constants to give your graph a different size and position on the screen. There is a header file attached to the main sketch, it contains the colour codes of some colours, try changing the colour of the chart and the bars. And that is it, your personalised graph is ready.
Libraries
- Elegoo Libraries - Copyright (c) 2012 Adafruit Industries under the BSD License.
- DHT - Author Rob Tillaart this library is in the public domain
I recently published a project that graphs 1, 2, 3 or 4 values on a bar chart. I have decided to publish another template for graphing. There are no templates for bar charts that don't have lines all over the place threatening to confuse, so I decided to do the math again and publish a simple project that allows everyone to graph their data on a history graph, live.


_wzec989qrF.jpg?auto=compress%2Cformat&w=48&h=48&fit=fill&bg=ffffff)


Comments
Please log in or sign up to comment.