


Hardware components | ||||||
 |
| × | 1 | |||
| × | 1 | ||||
 |
| × | 1 | |||
Software apps and online services | ||||||
 |
| |||||
In today’s modern world, most of the products that we produce have a very crucial factor affecting it i.e. temperature. Starting from the traditional crops to the artificial ones in food industries, from drugs to chemicals manufactured in the pharmaceutical industries, all of them need the right amount of temperature to be maintained for manufacture which is why the monitoring of temperature constantly is an indispensable part of these sectors.
Our homes too have athermostat installed which monitors and regulates the temperature. Maintaining the right temperature is required for having a healthy growth of plants. If the right temperature is not maintained, the plants will die.
Using this project, you will be able to build such a monitoring system where you will be able to monitor the temperature of the environment in the form of visual graphs. This project can then be extended to predict the future sensor values via Machine Learning over the Bolt Cloud.
Gathering all required componentsHere is what you need for the project. All of these components are included in the Bolt Starter Kit.
1. Bolt WiFi Module
Bolt WiFi Module
2. LM35 IC (Temperature sensor)
1 / 2 • Pin Out
Let's get started and build our systemBefore you move to Step 1, make sure that your Bolt WiFi Module is connected to Bolt Cloud and the green LED on the Bolt Moduleis Glowing. If not then follow the steps in this project to set up the device: Setting Up the Bolt WiFi Module.
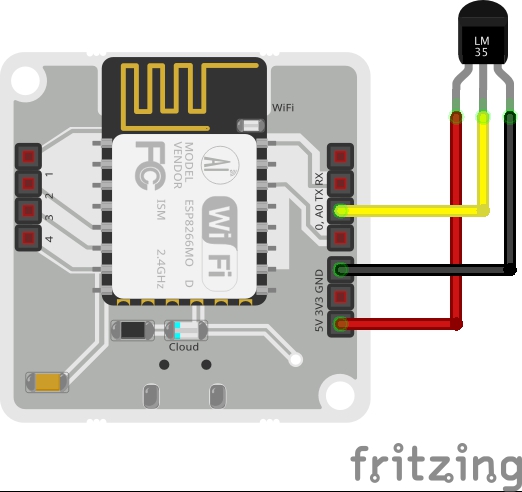
Step 1: Connecting LM35 to BoltFollow the connections as mentioned below. It was as easy as saying 1, 2, 3. You can refer the pinout of the LM35 sensor as shown in the image below,
NOTE: Click on arrows< and > to see image for the next step.
1 / 2 • LM35 Pin Out
1. Make sure you have not powered on your Bolt Module white connecting the circuit. This will ensure that in case we make any mistake, it will not short circuit your device. Switch off the power if it is connected.
2. Connect the VCC pin of LM35 to the5V pin of the Bolt device.
3. Connect the GND pin of LM35 to theGND pin of the Bolt device.
4. Connect the analog output pin of LM35 to theA0 (analog input) pin of the Bolt device.
NOTE: Click on arrows< and > to see image for the next step.
1 / 5 • Components
NOTE: Make sure connections are made properly. Ensure that there is no short-circuit inthe connections.Use jumper wires for ease in making connections.
Congratulations, we are done with the hardware. See how simple it was. Let's move on to the next step.
Step 2: Connecting Bolt to CloudSkip this step, if you already know how to connect your Bolt device to the Bolt Cloud. To check if it is connected to the cloud, have a look at the Green colored Cloud LED on the Bolt WiFi Module. It should be glowing.
Follow the steps in this project to set up the device and to connect your Bolt device to the Bolt Cloud.: Setting Up the Bolt WiFi Module.
Yes. I am aware that we have repeated this step. But we realized that many users tend to miss out on this step so wanted to be double sure about it. Now that our Bolt is active, we are just a step away from completing the system.
Step 3: Visualising the Data (Plotting Graph) on the Bolt CloudNow we need to visualize the temperature data on the Bolt Cloud. For this create a FREE account on cloud.boltiot.com if you have not already.
Just follow these simple steps:
1. Login into cloud.boltiot.com and click on the 'Product' tab.
Go to theProduct tab
2. Create a new product for your temperature monitoring system. Products are created once and can be used for multiple Bolt devices. This ensures scalability for the IoT products you build on Bolt.
Note: Product names can only have alphabets, numbers, and underscores (_ ) as a special character.Spaces are not allowed.
Note: Click on the arrow keys to see screenshotsof other steps.
1 / 2
3. Click on Configure this product to configure the product. This will open a popup where you can configure your product's hardware setting and write the software code.
4. Click on the "A0" pin of the Bolt and give it a name in the right side naming section. Finally, click on the "Save" icon to save your change and wait for the page to reload.
5. Click on the Code Section then click on the "Import Code example" icon as shown below. This will open a pop-up menu where you can choose the variable. In this code since we have connected only one sensor, you could simply choose the only variable in the dropdown and press OK.
1 / 2
6. Now you will be presented with a variety of graphs to choose from. Choose the "Line Graph" and then click on the "Import" button.
Now let me explain each line of the code so that you could make suitable changes as you wish.
setChartLibrery function sets the Data Visualisation Library you would use. The most commonly used one on Bolt Cloud is the Google Library. However, you could use any other JavaScript or HTML code here to visualize the data.
set chart title function sets the Title of the Chart/Graph. Give a suitable name for your graph here which will be shown in the heading of the page. This is different from the name of the code file.
set chart type function is where you choose which type of chart you want i.e. Line Graph, Bar Graph, etc.
setAxisName will set the name for the X-Axis and Y-Axis
plot chart is where you choose which variable you want to choose in your chart.
If you want to know more about the Data Visualisation then click here
7. Next, we will need to convert the raw sensor value received to degrees. For this, we will need to multiply the raw sensor value with 0.0977. I have given an explanation for this towards the end of the project.
For multiplication, we use the 'mul' function. Just enter the line mul (0.0977) before the plot chart function. This will multiply the sensor value received with the multiplication factor.
8. Now write the file name for your code and choose the file extension as "js".
Finally, click on the "Save" icon to save the changes to the product.
9. Now, our product configuration is ready, but we need to "link" a bolt device to the product so that the Bolt can actually start sending temperature data.
1 / 4 • Click on the link tab
9. Now, we need to deploy the code to the Bolt device. Deploying will transfer the code and configuration to the Bolt device. It's similar to programming a hardware device like an Arduino. Except here the programming happens over the internet.
Deploy code
10. That's great you say. Now how do I see the temperature? For this, you will need to click on the "Computer Monitor" icon on your Bolt device.
View the plot
This will open up a new page which will have a graph. Every 5 minutes, the Bolt will send a temperature reading to the Bolt Cloud.
If you see a blank graph, wait for a few minutes for the device to send the sensor reading to the cloud. If you don't want to wait then you could press the push configuration button again. Every time you click on that button it sends the current sensor value to the graph. It's a manual method that can be used for testing.
Output PlotAs the cloud collects more data, the graph gets plotted and you will be able to see the temperature variations across the day.
Working principleThe working principle of the system is quite easy. Let me understand.
Here in our system, LM35 is the sensor that senses the temperature of its environment, and based on its value it generates an analog output voltage. This analog voltage produced by the LM35 is then given as input to the Bolt A0 pin. The Bolt then converts the analog value into a 10-bit digital value that varies from 0-1023. This digital data is sent to the cloud via Bolt device.
Hence, while plotting the temperature, it is required to convert the raw sensor values into the actual temperature value, which is done using the given formula:
temp = (analog_value*100)/1023
The converted digital data is then plotted for visual representation.


Comments