The future of medicine lies in the continuous monitoring of our health. Early disease diagnosis is an important part of this future. Yet current diagnostic methods do not meet the need for frugal health devices, which can be used by everyone at home. Our team seek to use this approach for early detection of certain types of cancer. We were developing a prototype for a cheap and easy-to-use probe with a potential application in detection and monitoring of cancerous tissue. The hardware for this project constituted either a two-pin microelectrode or a 2x2-microelectrode array integrated into a recording circuit based on components provided by Biomaker. The two probes were calibrated using JenwayTM conductivity meter and standard sodium chloride (0 to 1 g/L) solutions. The probes were also tested on gelidifed NaCl solutions with varying concentrations. Finally, both probes were tested on artificial biological systems that mimicked electrical properties of normal and cancerous tissues. The results showed that the probe could detect areas of increased conductivity that corresponded to phantom cancer. The next step is to incorporate 3D microelectrode arrays (Multi Channel Systems MCS GmbH) and run tests on phantom tissue and possible on real biological samples.
ObjectivesThe main objectives of this project were: 1) to build a sensor containing two conductive needles; 2) to build a recording system using Biomaker components provided; 3) test the system on phantom cancer tissue (gels mimicking electrical properties of cancer tissue); and 4) advance the sensor design from a 2-needle system to a 2x2 microneedle array system.
Timeline1-15 June: Learning.
We built a simple circuit by using Nichrome wire electrode and familiarized ourselves with the XOD programming by attending all the training sessions. We had problems with electrolysis of water at 5V input voltage, which caused corrosion of wire electrode. We solved the issue by sending low voltage PWM signal (20% duty cycle) from digital pin (D11).
16-30 June: Improving probe design.
We used subdermal needle electrodes (UnimedTM) to build 2-pin probe. It was built by casting the needles inside a gel and solidifying it to ensure rigidity of probe.
1-7 July: 2-pin probe calibration and tests on agarose gels.
We obtained the cell constant of probe from the calibration data. Our first conductivity values were in agreement with the literature.
8-15 July: Building 2x2- pin probe in rectangular array.
We designed a probe with four pins so we can collect more values and record the conductivity values of multiple spots in a gel simultaneously. We used 16-channel analog multiplexer but it did not give us reliable readings. Instead, we used three analog input pins from Rich Uno R3 board to read voltage from three pins (the 4th pin was a reference pin).
16-18 July: 2x2 array probe calibration. We calculated the cell constant for each pair of pin from the calibration data.
19-22 July: Hectic days and long nights. Final tests of 2x2 array probe on the phantom tissue, analyzing data, comparing 2-pin vs 2x2 array data and writing the report.
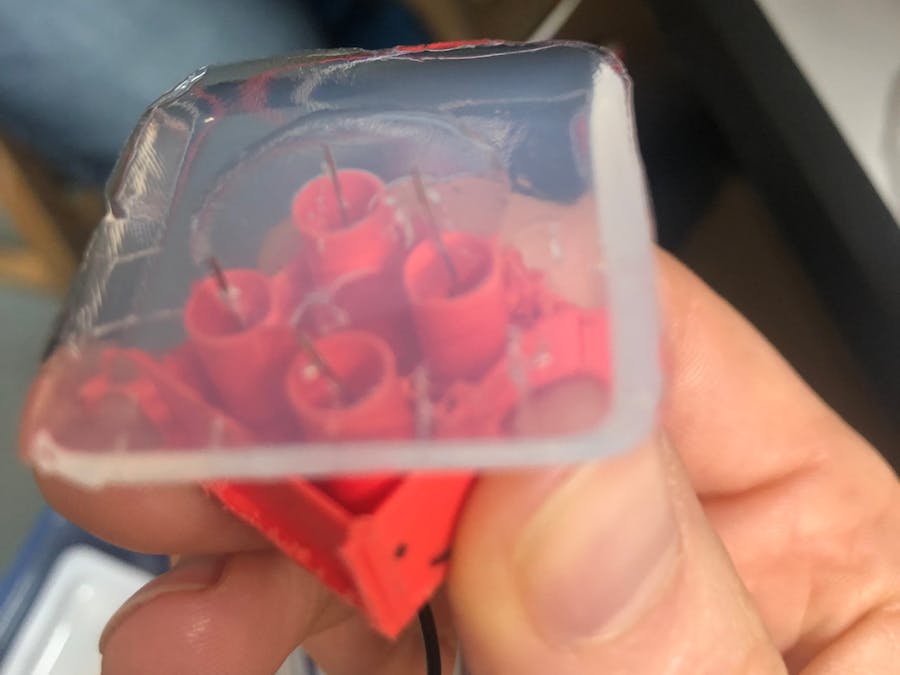
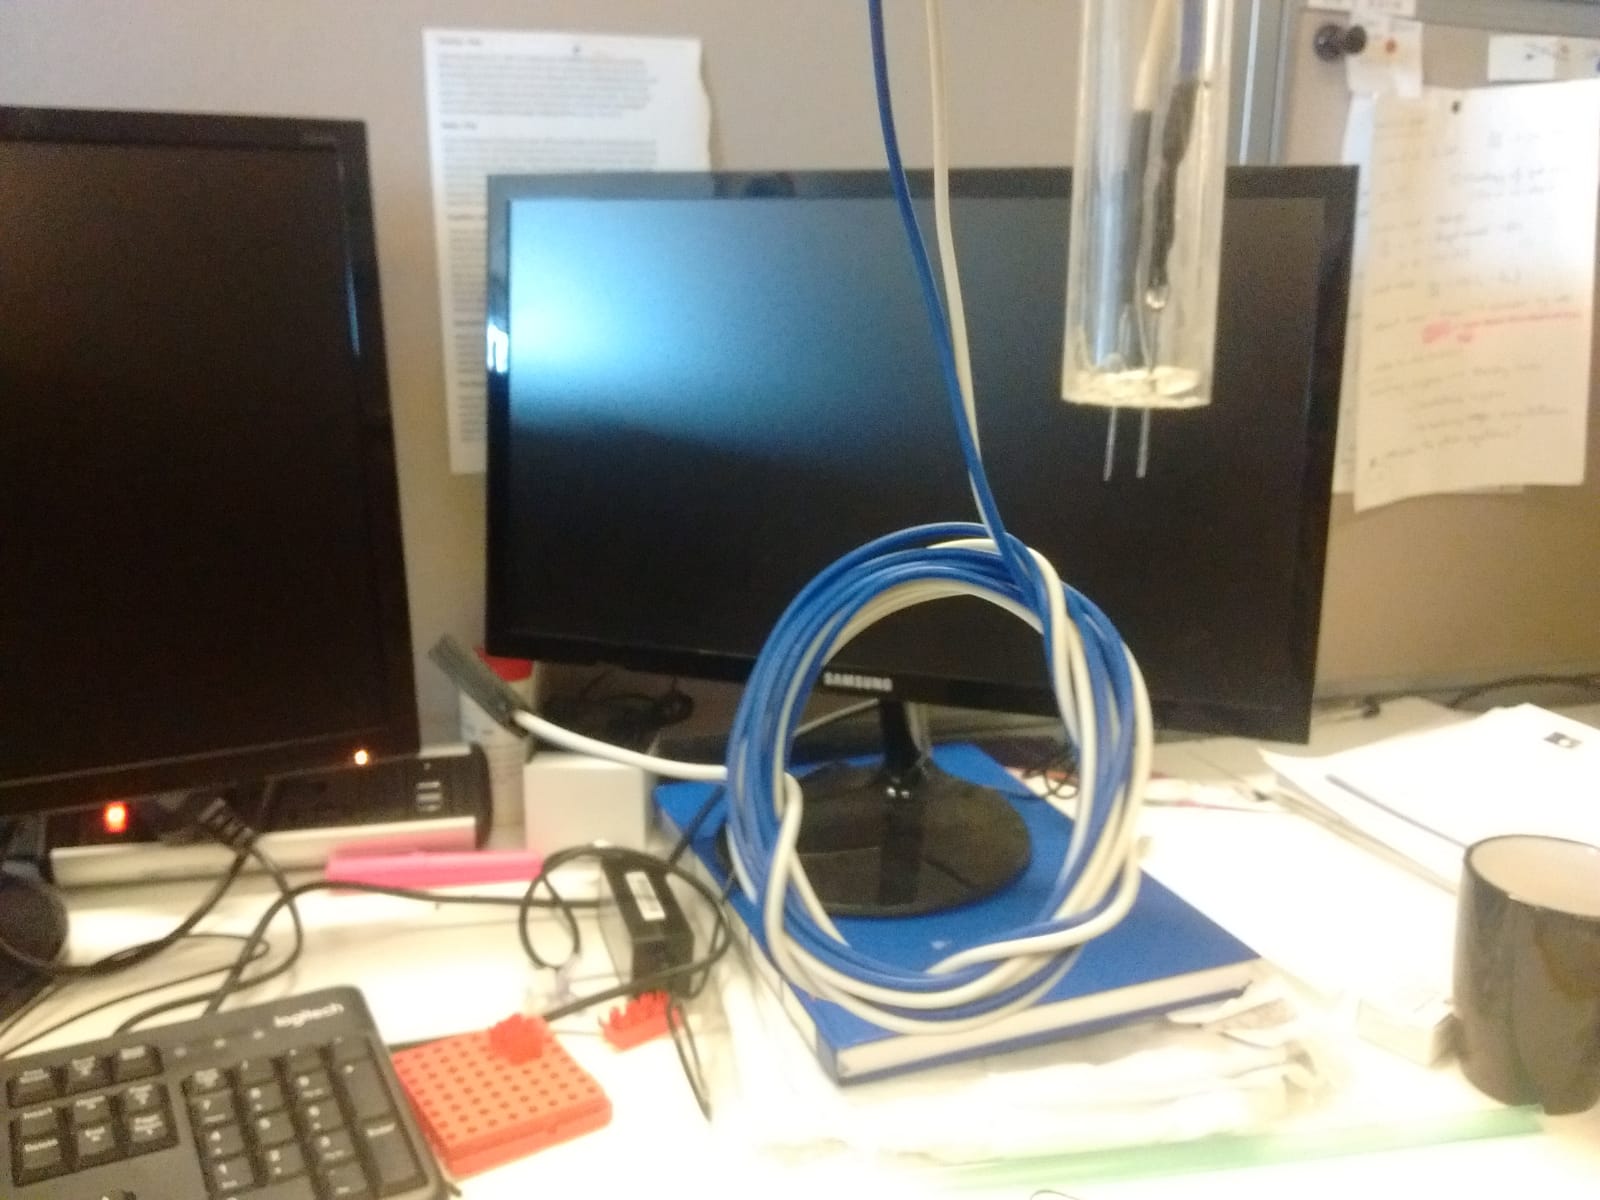
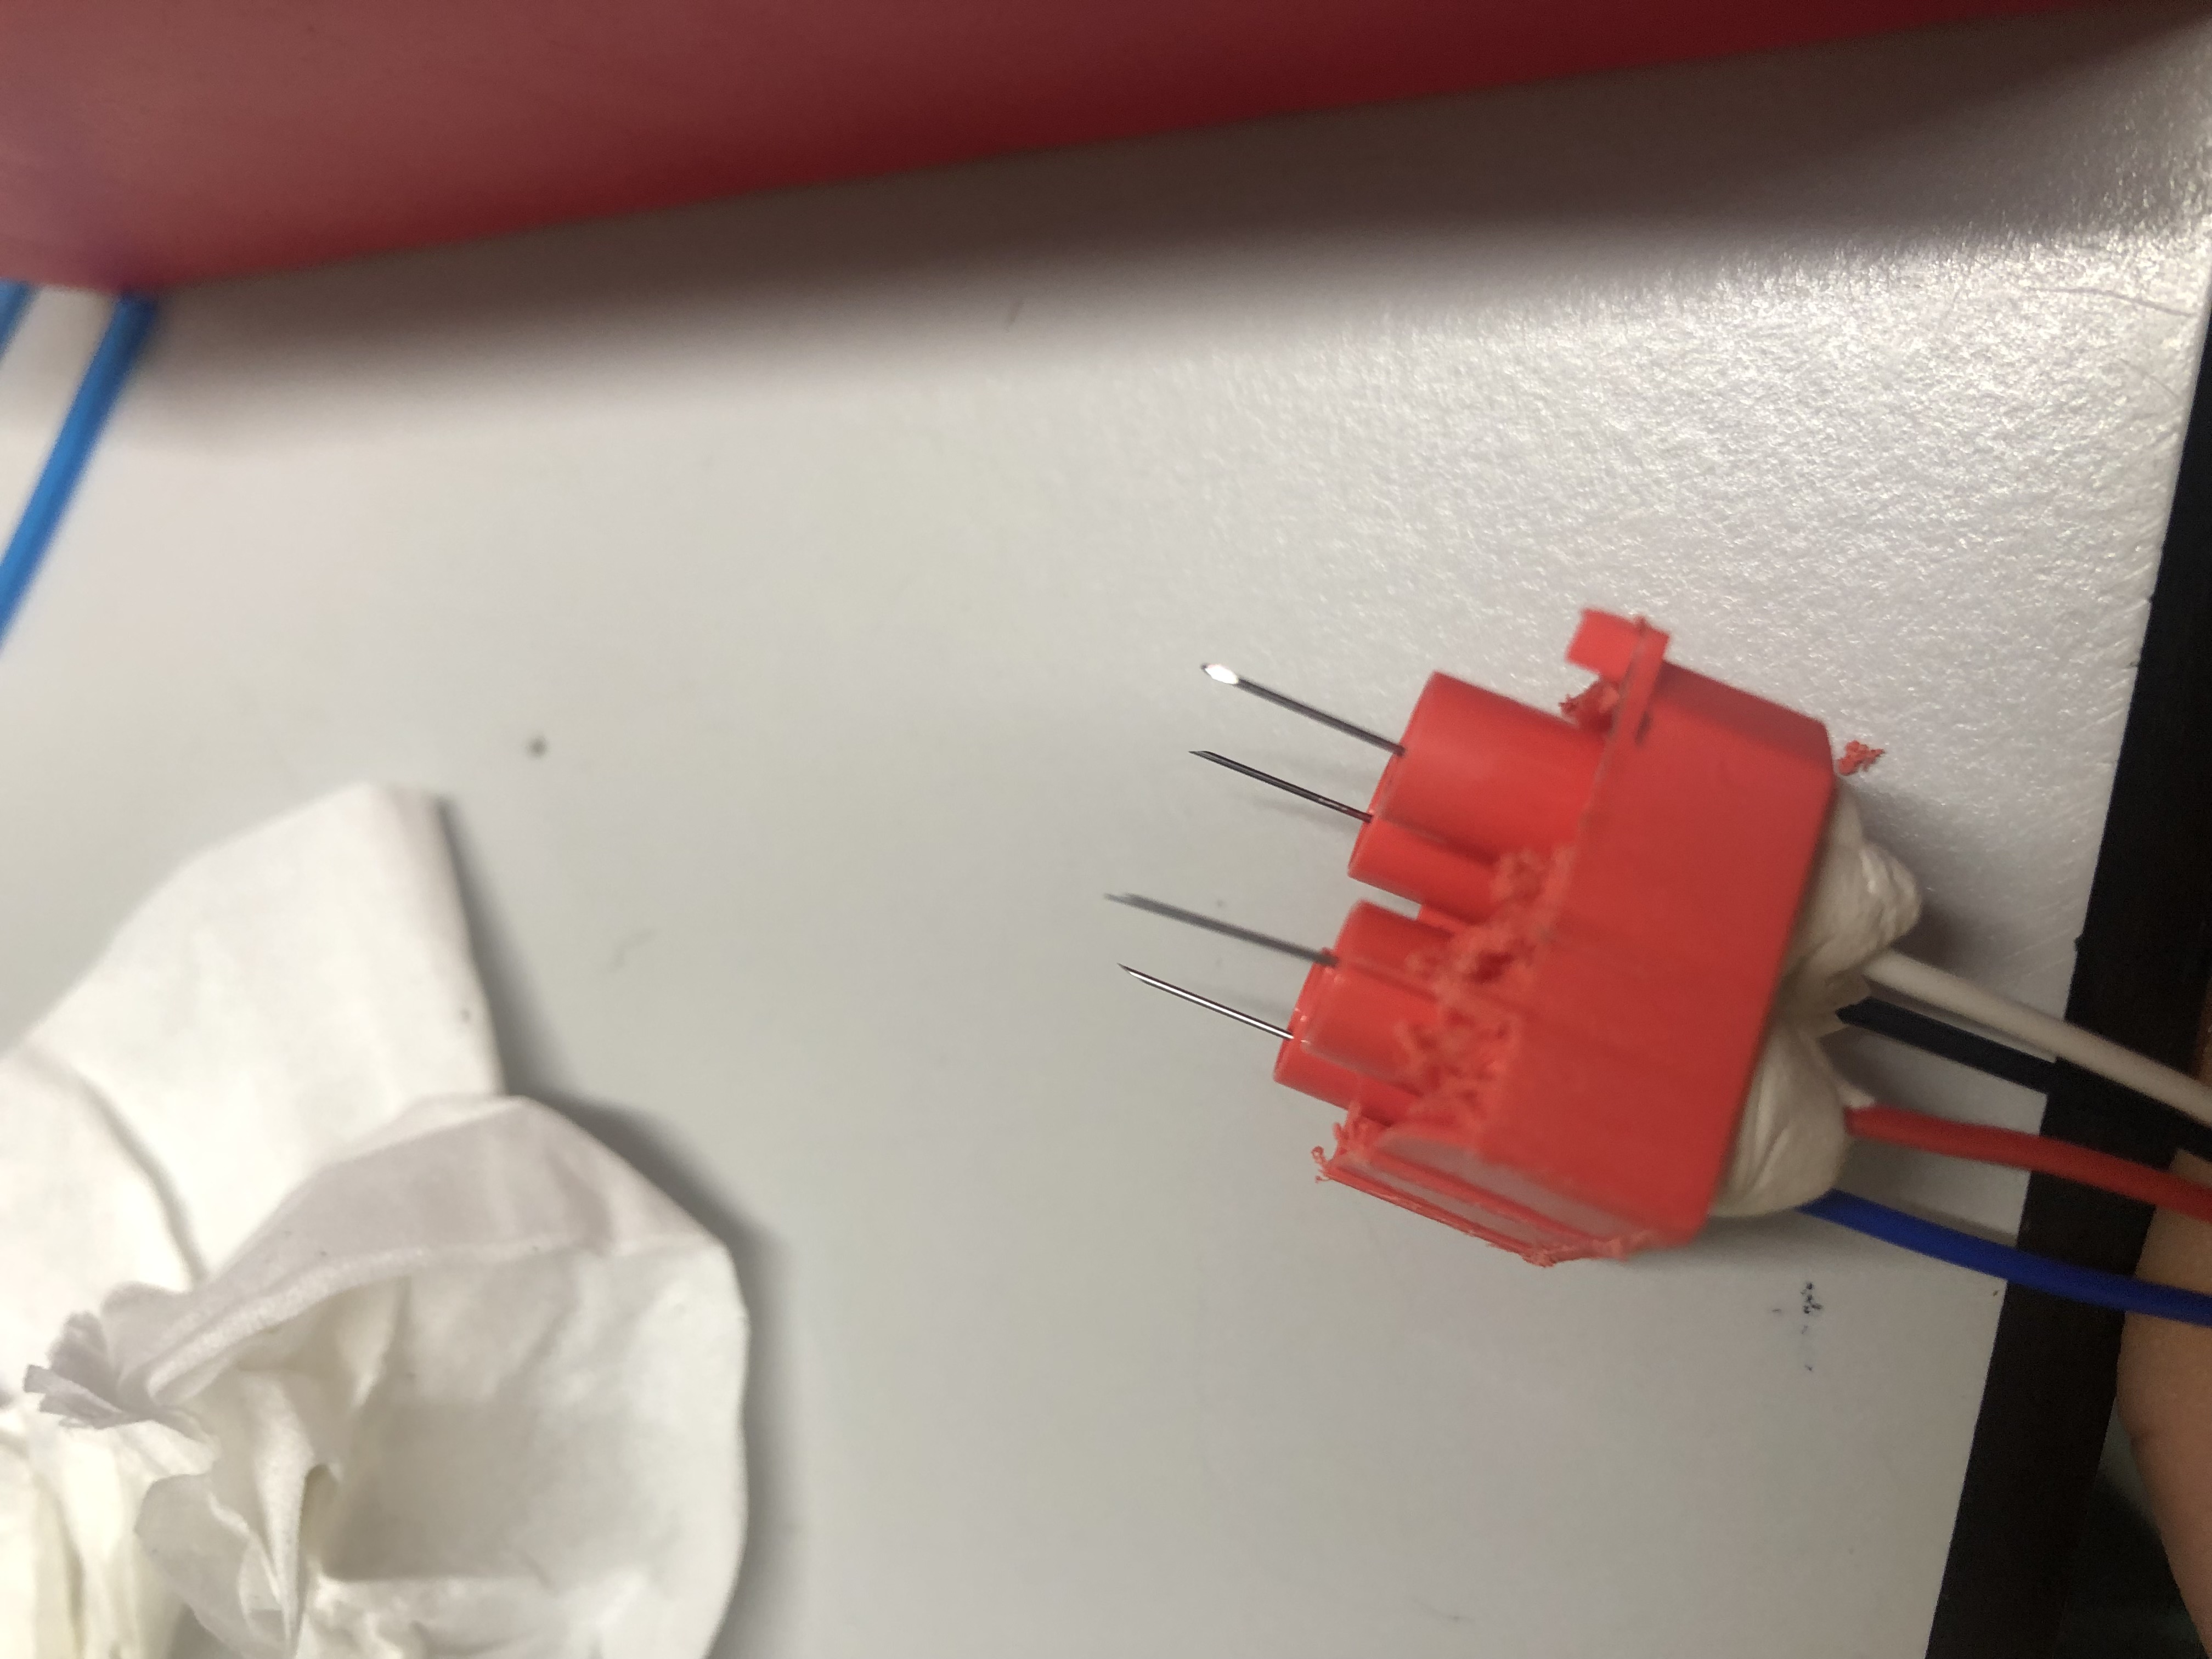
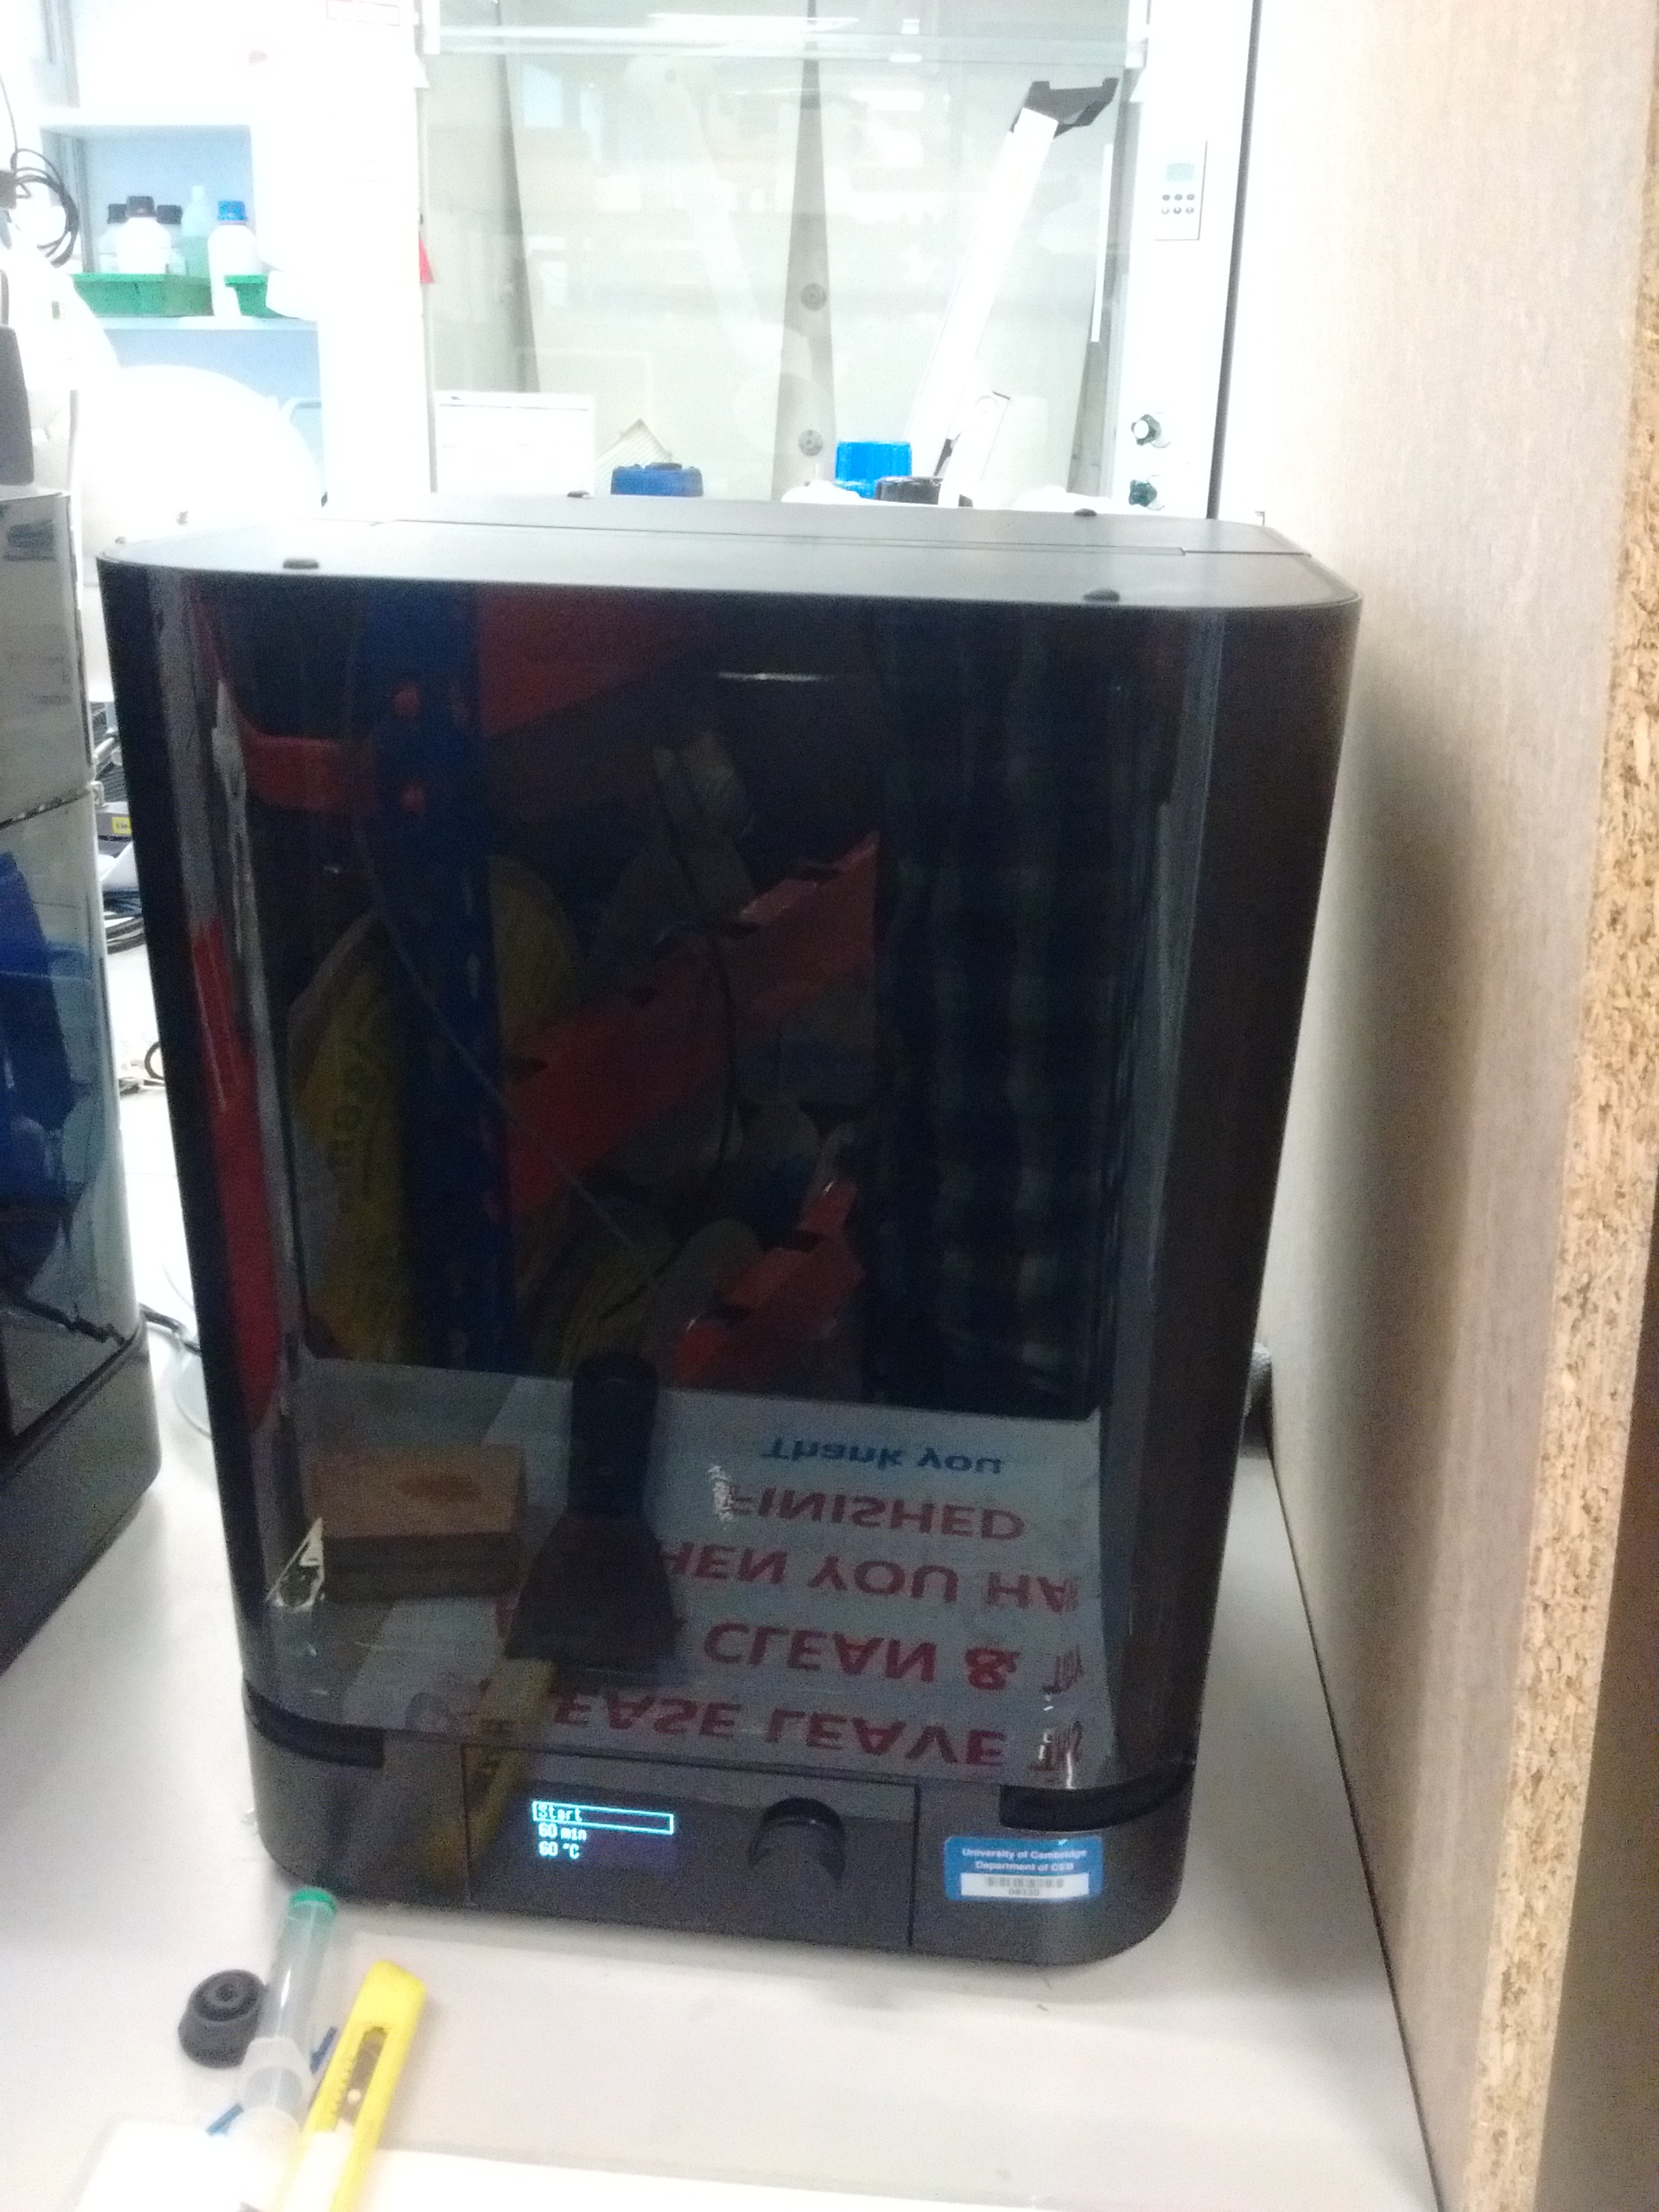
Sensor designThe 2-pin sensor was built by using subdermal needle electrodes (UnimedTM) which are made of stainless steel. A hollow circular Perspex tube was used as a holder for the needles and wires (Figure 1, top-left). The opening of tube was sealed by casting needles inside the Formlabs resin which was 3D printed in Form Cure at 60°C. A sealed opening ensures that the gel doesn’t percolate inside the tube while doing conductivity tests. The 2X2 pin probe was built using 4 subdermal needle electrodes and a plastic holder with 4 holes. The needles were secured with an adhesive (Figure 1, top-right).
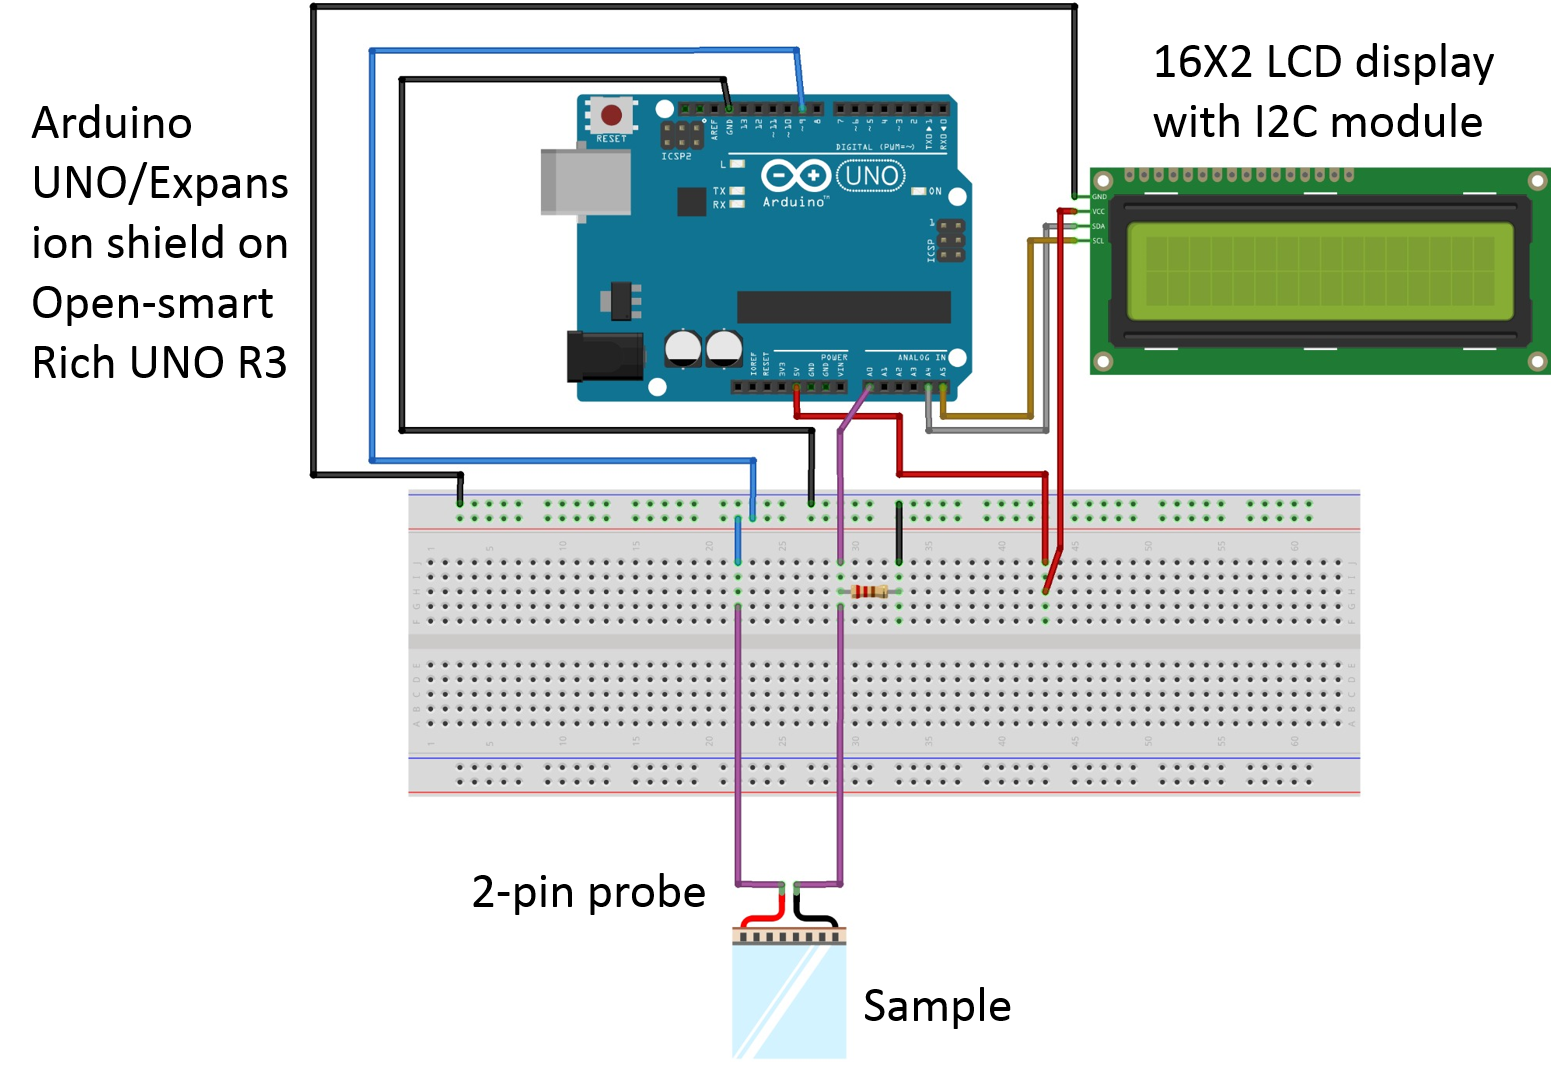
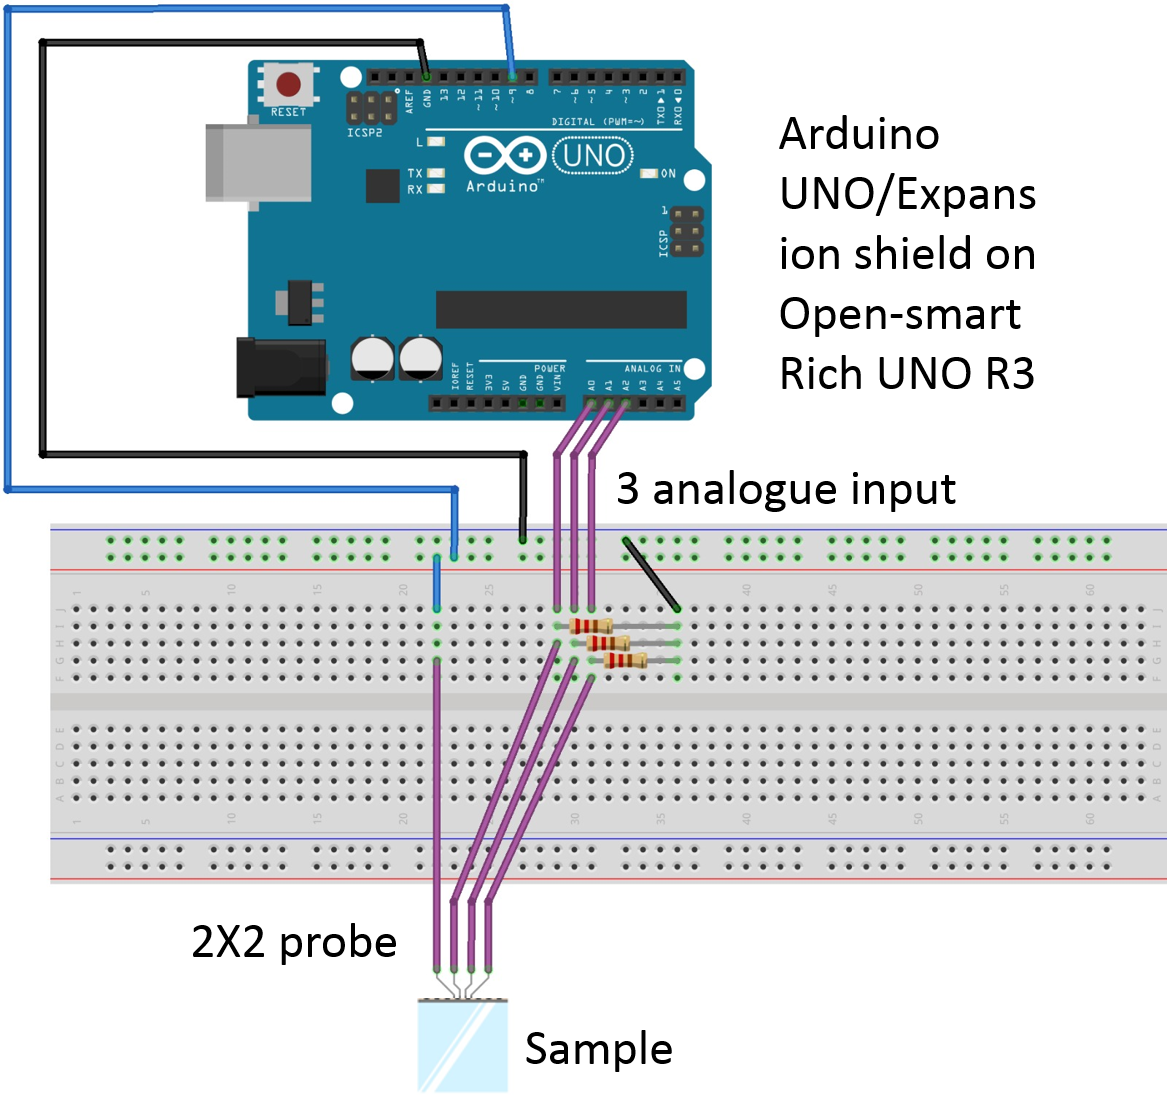
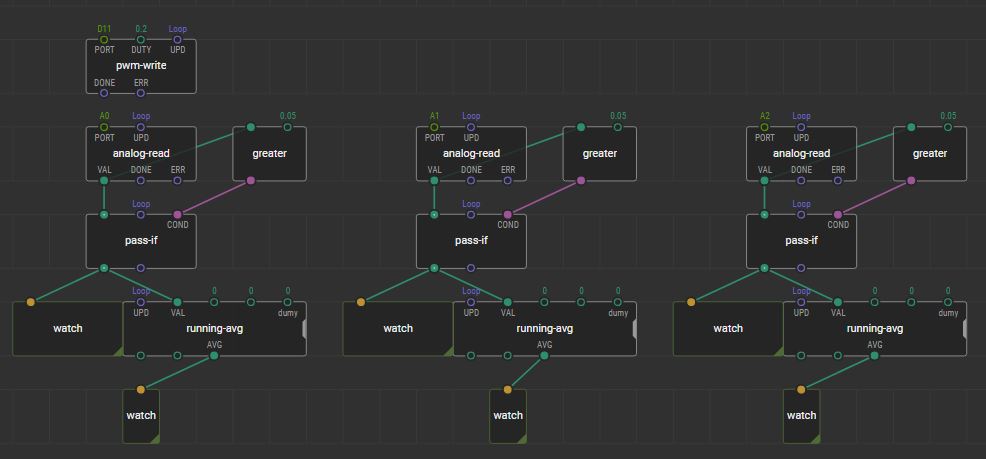
Electronic setup/HardwareIn Figure 2a, voltage values are displayed on the LCD (with I2C module) display. In Figure 2b three analog pins (A0-A2) are used to read voltage values and display directly on the Serial Monitor (Arduino UNO) and watch node (XOD Rich UNO).
Description of electronic setup
A 20% duty cycle PWM signal was sent from pin D11 (Rich UNO) and digital pin 9 (Aruino UNO) to the gel sample which is connected in series with a 10kΩ resistor. The voltage drop across the sample is measured by reading voltage using analogRead() node/function. In Arduino UNO, it is read in 10-bit format and converted from a scale of 0-1023 to the scale of 0-1V (20% duty cycle of 5V). Current in the circuit is measured using BSIDE ZT301 Digital Multimeter. The current reads RMS value which is converted to peak voltage by multiplying by √5 (I_RMS=I_peak √(t/T) where t/T is 1/5 for 20% duty cycle).
In XOD code, a filter of 0.05V is used to display non-zero voltage values (80% of the values read are zero because of PWM signal).
Probe calibrationThe cell constant, C, is equal to the distance (in cm) between the probe's electrodes divided by the surface area of the electrodes (in cm2). We have used a standard conductivity probe (JenwayTM) to determine the cell constant for our probes. Table 1 shows cell constants for the 2-pin probe (C2-pin) and 2x2 array probe (C2x2).
The cell constants for the white and blue pin are similar and the cell constant for the red pin is higher. This is consistent with spatial distribution of pins relative to the reference electrode (Figure 5).
Cell constant - example calculation
The cell constant was calculated for three different NaCl concentrations and an average was used in future calculations.
2-pin probe. Measuring specific conductivity of agarose gelsTo test reliability of the 2-pin probe in tissue-like materials, we prepared agarose gels (1.2% w/w agarose in MiliQ water). Sodium chloride was used to prepare biologically relevant range of electrical conductivities. Figure 6 shows relationship between the specific conductivity of the agarose gels at different concentrations of NaCl at 18°C. The values obtained from the 2-pin probe (x) are comparable to previous observations reported by Ref. [1]. Shaw et al. measured the values at 22°C and with AC (500 Hz) rather than DC as in our case. Ref. [2] reported that conductivity of tissue does not change significantly for AC current frequencies between 10-10000 Hz. The DC electric conductivity can be extracted from a set of AC electrical measurements by extrapolating these values to 0 Hz [3]. Using DC current can be justified when electrode polarization can be neglected by using voltage lower than electrolysis voltage (1.23 V). In our case, by sending 1 V PWM signal the polarization effect was prevented.
The values obtained from the 2-pin probe (x) are comparable to previous observations reported by Shaw et al (●)
2-pin probe vs 2x2 array testWe have repeated the same experiment for the 2x2 array sensor and compared the values with the 2-pin sensor (Figure 7). The conductivity values measured with the 2x2 array sensor are higher than the conductivity values measured by the 2-pin sensor. The discrepancy may be caused by imperfections in the current probe design, multiplexing issues or/and gel sample thickness. Further experiments need to be done to improve the conductivity measurements.
The conductivity values measured with the 2x2 array sensor (grey, blue and red lines) are higher than the conductivity values measured by the 2-pin sensor (black line).
Measuring specific conductivity or phantom cancer tissueThe artificial tissue samples were made by dissolving agarose (1.2% w/w) in MiliQ water at 100°C. After cooling the solution to 37°C, NaCl was added: 0.5 g/L for normal tissue and 1 g/L for cancerous tissue. The solutions were left to set overnight and ready for testing the next day (Figure 8).
NaCl concentrations were chosen to mimic electrical properties of normal liver tissue (1.26 ± 0.15 mS/cm at 10 Hz) and hepatic tumour (2.69 ± 0.91 mS/cm at 10 Hz) [2]. Table 2 show specific conductivities obtained from preliminary experiments on phantom cancer tissue for the 2-pin sensor and 2x2 array sensor.
Again, the conductivity values measured with the 2x2 array sensor are higher than the conductivity values measured by the 2-pin sensor (similar as for the previous test: 2-pin vs 2x2 array). However, we could still detect the differences in conductivity between the normal tissue and the cancer tissue. In the case of the 2x2 array the difference is statistically significant (p<0.05).
Future work1. Improve the probe design: After experimenting with 2 and 2X2 pin probe, we plan to increase the number of pins in our probe (Figure 9a). It will enable us to measure spatial distribution of conductivity in a mixed sample: containing both normal and cancerous tissue. We have ordered 60 pins 3D micro-electrode array (12 µm diameter and 100 height) (Figure 9b) which will help us to remove the inconsistency in probe design and build a circuit for 60 pins. Subsequently, we will head towards 3D printing a custom polymer micro-electrode array which is bio-compatible.
2. Enable multiplexing in the circuit (Figure 10): Rich UNO R3 board can read maximum 6 analog inputs. An 16-channel analog multiplexer can solve this problem by linking 16 input pins to one analog input. To shift from 16 pins to 60 pins, we will use 4 analog multiplexers which will increase the input data rate. To enable faster data logging and processing, we will switch to Raspberry Pi 4 Model B with LCD 7” touchscreen display which will show the 3D impedance map of a phantom tissue (to identify the regions of low and high conductivity).
3. Shifting from DC to AC signal processing: Biological tissues have both capacitive and resistive components. Hence, impedance measurements of actual tissue is the conventional way of evaluating impedance map of the tissue. Furthermore, AC signal can stop the polarisation effect (electrolysis and corrosion) on the electrode. To enable AC signal processing, we are planning to use a DIY signal generator, Arduino-compatible oscilloscope, and RMS multimeter to send and process AC signal.
References[1] M. A. Kandadai, J. L. Raymond, and G. J. Shaw, “Comparison of electrical conductivities of various brain phantom gels: Developing a ‘brain gel model, ’” Mater. Sci. Eng. C, 2012.
[2] D. Haemmerich, S. T. Staelin, J. Z. Tsai, S. Tungjitkusolmun, D. M. Mahvi, and J. G. Webster, “In vivo electrical conductivity of hepatic tumours, ” in Physiological Measurement, 2003.
[3] J. H. Chandler, D. G. Jayne, A. Neville, and P. R. Culmer, “A novel multiple electrode direct current technique for characterisation of tissue resistance during surgery, ” in Proceedings of the Annual International Conference of the IEEE Engineering in Medicine and Biology Society, EMBS, 2015.



_ztBMuBhMHo.jpg?auto=compress%2Cformat&w=48&h=48&fit=fill&bg=ffffff)




Comments
Please log in or sign up to comment.