


Hardware components | ||||||
_ztBMuBhMHo.jpg?auto=compress%2Cformat&w=48&h=48&fit=fill&bg=ffffff) |
| × | 1 | |||
Software apps and online services | ||||||
 |
| |||||
| ||||||
Did you ever have the need to display data from a microcontroller on a dashboard, and spent more time developing (and fixing) your dashboard software, than actually working on your MCU project?
Well, I did, multiple times. Let me put you in context, I participate in several CanSat competition programs through KA'AN SAT, a representative team at my university. A CanSat is “a simulation of a real satellite, integrated within the volume and shape of a soft drink can” (European Space Agency, more info). One of the main tasks in these competitions is to develop software for the ground station. The ground station software (GSS) receives telemetry from the CanSat in real time through a serial device (generally a XBee), displays it and exports it to a CSV/Excel file for post-mission analysis.
From the start, we developed the GSS with Qt to support multiple operating systems (in case that one of our computers experienced problems during the competition) and because Qt/QML is very convenient for developing eye-catching user interfaces.
Here is a screenshot of the 2019 ground station software:
And a photo of the GSS running & displaying telemetry during the CUCEI CanSat competition:
If you are interested, the source code for the 2019 GSS is available here. The software worked quite well for all its intents & purposes (we got the first place after all).
The problems came half a year later, when I found myself working on multiple projects that required some kind of data acquisition with serial devices. For example, some members of ROCH (another representative team in our university, which participates in the NASA Human Rover Exploration Challenge) wanted to integrate our GSS with their rover as a side-project during quarantine.
The result was disastrous; I got a call late at night and we ended up pulling an all-nighter to come up with a way to adapt the GSS with the telemetry that they were receiving. Finally, the software worked, but the UI integration was horrible & data export was not really functional (see the screenshot below to get an idea):
Both projects (the CanSat and the rover) had a similar telemetry format (sensor readings & OBC status data separated with commas). However, the information itself had a different order.
After that experience, I decided that I had enough of writing separate dashboard software for every project that I got involved with. I needed to come up with a way to have the same dashboard/GSS software to work with all projects, without the need of modifying the GSS code at the last minute.
The initial solution that I came up with was to create a JSON-based communication protocol between the GSS and the microcontroller, and thus Serial Studio was born (its initial name was SigLAB, but I changed my mind later).
Basically, the microcontroller sends the following information through the serial port:
- Project title.
- Current sensor readings & OBC status.
- What each reading meant, its measurement units and what should the GSS do with that reading (e.g. create a real-time graph of the measured atmospheric pressure).
All this information can be easily represented in a JSON document, for example:
{
   "t":"KAANSATQRO",
   "g":[
      {
         "t":"Mission Status",
         "d":[
            {
               "t":"Runtime",
               "v":"%value%",
               "u":"ms"
            },
            {
               "t":"Packet count",
               "v":"%value%"
            },
            {
               "t":"Battery voltage",
               "v":"%value%",
               "g":true,
               "u":"V"
            }
         ]
      },
      {
         "t":"Sensor Readings",
         "d":[
            {
               "t":"Temperature",
               "v":"%value%",
               "g":true,
               "u":"°C"
            },
            {
               "t":"Altitude",
               "v":"%value%",
               "u":"m"
            },
            {
               "t":"Pressure",
               "v":"%value%",
               "u":"KPa",
               "g":true
            },
            {
               "t":"External Temperature",
               "v":"%value%",
               "g":true,
               "u":"°C"
            },
            {
               "t":"Humidity",
               "v":"%9",
               "g":true,
               "u":"%value%"
            }
         ]
      }
   ]
}
As you can see, we have the following structure:
- Project title (string)
- Array of data groups, for each group:
- Group title (string)
- Array of datasets, for each dataset:
- Title (string)
- Value (string)
- Units (string)
- Graph request (boolean)
A group consists of values that are closely related to each other, for example:
- OBC status (first group in our example)
- Sensor readings (second group in our example)
- Accelerometer readings (X, Y, Z)
- GPS readings
- Etc.
On the other hand, datasets represent what each individual value means, and what we should do with it.
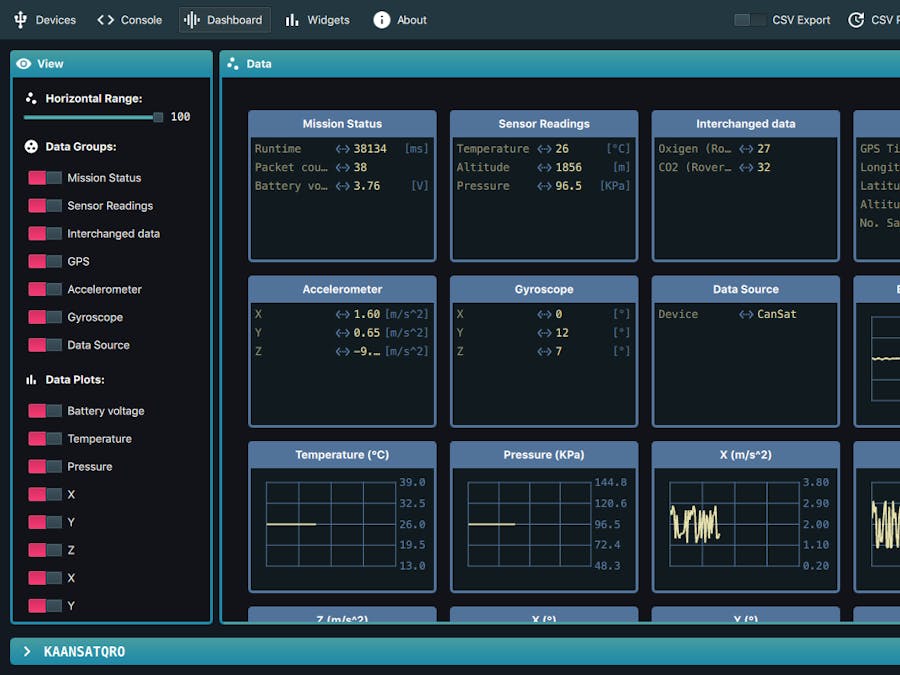
On Serial Studio, this information is displayed in the following manner:
As you can probably deduce, each “window” corresponds to a group in our JSON document (I hid the graphs in the screenshot to avoid confusion).
This approach works beautifully for small projects. However, for more complex projects, creating and sending a large JSON document through serial (or through radio signals, and then through a serial port) becomes quite problematic. The solution? Load the same JSON document from your computer, instruct the microcontroller to send ONLY the sensor/data readings & let Serial Studio figure out the rest by using the indices of each received value in a comma-separated data frame.
Doing so lets you have the best from both worlds:
- You don’t need to write specific dashboard/GSS software for each project (and you get all the nice features that we described earlier).
- And you don’t need to create & transmit a large JSON document from your microcontroller (heck, the person working on the microcontroller software doesn't event need to know what JSON is or how it works).
A JSON “map” document looks like this:
{
   "t":"%1",
   "g":[
      {
         "t":"Mission Status",
         "d":[
            {
               "t":"Runtime",
               "v":"%2",
               "u":"ms"
            },
            {
               "t":"Packet count",
               "v":"%3"
            },
            {
               "t":"Battery voltage",
               "v":"%4",
               "g":true,
               "u":"V",
               "w":"bar",
               "min":3.6,
               "max":4.3
            }
         ]
      },
      {
         "t":"Sensor Readings",
         "d":[
            {
               "t":"Temperature",
               "v":"%5",
               "g":true,
               "u":"°C",
               "w":"bar",
               "min":0,
               "max":80
            },
            {
               "t":"Altitude",
               "v":"%6",
               "u":"m",
               "w":"bar",
               "min":0,
               "max":3000
            },
            {
               "t":"Pressure",
               "v":"%7",
               "u":"KPa",
               "g":true,
               "w":"bar",
               "min":54,
               "max":102
            },
            {
               "t":"External Temperature",
               "v":"%8",
               "g":true,
               "u":"°C",
               "w":"bar",
               "min":0,
               "max":80
            },
            {
               "t":"Humidity",
               "v":"%9",
               "g":true,
               "u":"%",
               "w":"bar",
               "min":0,
               "max":100
            }
         ]
      },
      {
         "t":"GPS",
         "w":"map",
         "d":[
            {
               "t":"GPS Time",
               "v":"%10"
            },
            {
               "t":"Longitude",
               "v":"%11",
               "u":"°E",
               "w":"lon"
            },
            {
               "t":"Latitude",
               "v":"%12",
               "u":"°N",
               "w":"lat"
            },
            {
               "t":"Altitude",
               "v":"%13",
               "u":"m"
            },
            {
               "t":"No. Sats",
               "v":"%14"
            }
         ]
      },
      {
         "t":"Accelerometer",
         "w":"accelerometer",
         "d":[
            {
               "t":"X",
               "v":"%15",
               "u":"m/s^2",
               "g":true,
               "w":"x"
            },
            {
               "t":"Y",
               "v":"%16",
               "u":"m/s^2",
               "g":true,
               "w":"y"
            },
            {
               "t":"Z",
               "v":"%17",
               "u":"m/s^2",
               "g":true,
               "w":"z"
            }
         ]
      },
      {
         "t":"Gyroscope",
         "w":"gyro",
         "d":[
            {
               "t":"X",
               "v":"%18",
               "u":"°",
               "g":true,
               "w":"yaw"
            },
            {
               "t":"Y",
               "v":"%19",
               "u":"°",
               "g":true,
               "w":"roll"
            },
            {
               "t":"Z",
               "v":"%20",
               "u":"°",
               "g":true,
               "w":"pitch"
            }
         ]
      }
   ]
}
As you can guess, Serial Studio will replace the %1,%2,%3,...,%20 values with the values at the corresponding index in a comma-separated data frame. The corresponding sprintf() format sent by the microcontroller for the given JSON map is:
/*KAANSATQRO,%s,%s,%s,%s,%s,%s,%,%s,%s,%s,%s,%s,%s,%s,%s,%s,%s,%s,%s*/You may have noticed some "w" keys in some places, these are used to build widgets (which are explained here). Finally, here is the obligatory GIF showing the usage of Serial Studio:
Pretty cool, right? If you are interested in using Serial Studio for your projects, here are the relevant links:
- Github repo: https://github.com/Serial-Studio/Serial-Studio/
- Documentation (GitHub wiki): https://github.com/Serial-Studio/Serial-Studio/wiki/Communication-Protocol
The prebuilt binaries/installers for Windows, macOS & GNU/Linux are available through GitHub releases: https://github.com/Serial-Studio/Serial-Studio/releases/
Minimal exampleSuppose that we want to graph the an ADC reading with an Arduino & export the data to a CSV table. Here is the Arduino code:
#define ADC_PIN A0

void setup() {
   // Initialize Serial port at 9600 bauds
   Serial.begin(9600);

   // Configure analog input
   pinMode(ADC_PIN, INPUT);
}

void loop() {
   // Read voltage @ ADC_PIN
   int adc_value = analogRead(ADC_PIN);
   float voltage = adc_value * (5.0 / 1023.0);

   // Send current ms & reading through serial
   Serial.print("/*");        // Frame start sequence  [/*]
   Serial.print(millis());    // Add MCU runtime       [ms]
   Serial.print(",");         // Separator character   [,]
   Serial.print(voltage);     // Add voltage           [V]
   Serial.print("*/");        // Frame finish sequence [*/]

   // Wait 50 ms
   delay(50);
}
Deploy this code to your Arduino and create a JSON file with the following contents:
{
   "t":"Minimal Example",
   "g":[
      {
         "t":"MCU Status",
         "d":[
            {
               "t":"Runtime",
               "v":"%1",
               "u":"ms"
            },
            {
               "t":"ADC reading",
               "v":"%2",
               "g":true,
               "u":"V",
               "w":"bar",
               "min":0,
               "max":5
            }
         ]
      }
   ]
}
Open Serial Studio & import the JSON file into Serial Studio by selecting the "manual" radio button in the top-left corner of the app & clicking on the "Change map file" button. Finally, select the appropriate COM port. If everything goes well, you should see a screen similar to this one:
If you click on the "Open current CSV" button, you will be able to see all the received information in an Excel/Calc table:
If you have any doubts, ideas or bug reports, feel free to add a comment, contact me or open up an issue at GitHub. Hopefully some random person on the internet will find this useful :)


Comments
Please log in or sign up to comment.