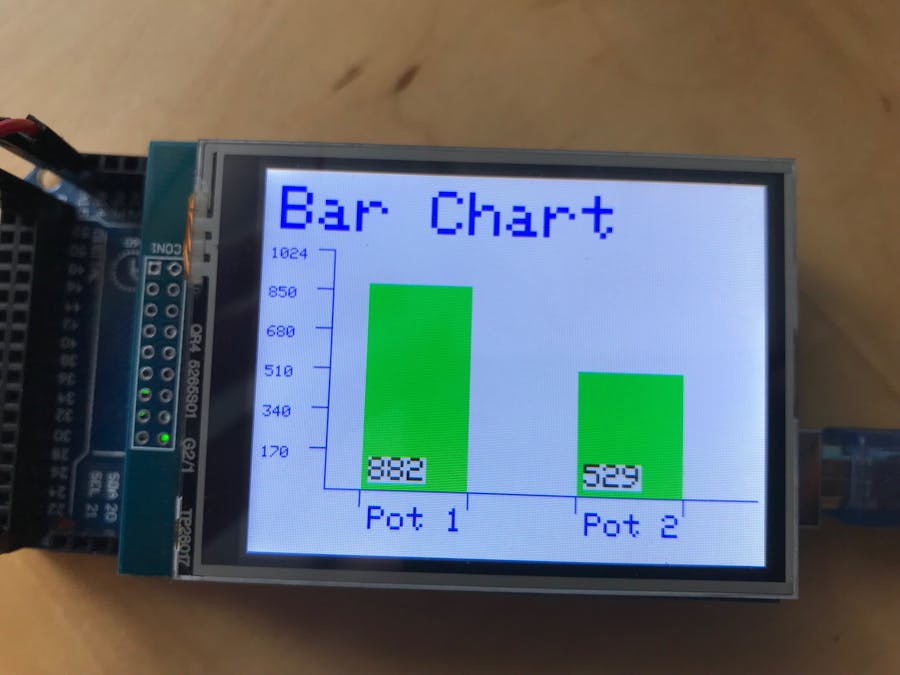
Everyone reads data from sensors connected to their microcontrollers and displays it using numbers, but have you ever wanted to display them in a new way? Graphing is the solution. The idea of graphs is good, but there is a problem; it involves wrecking your head with a load of calculations. It is particularly difficult to create a graph on a TFT LCD.
This project will familiarise you with the idea of graphing and by the and, you will be able to create your own bar chart and personalise it. All the hard calculations will be done for you, all you have to do is edit 5 variables, and you have your graph.
This project aims to make graphing fun and universal, giving you the ability to graph your data in seconds, the graph is fully flexible and can be personalised to make it yours, the user can edit the colours of the chart, the title, data displayed and others. The project allows you to graph from 1 to 4 values on the same graph, here is a flavour of the versatility of the chart.
The project has three functions, the first one displays a professional intro which you can exclude if you wish.
The second function will draw the graph, it will also label the x and y axis.
The last function will read the values of the sensors chosen, will map these values and then will draw the blocks/bars on the graph.
Below is a diagram illustrating the functionality overview of the project.
The device reads the sensors constantly and displays the data on the graph live, so the user can easily monitor the temperature in his/her house and his/her office live. Here is an image of the code overview.
Read Sensorswill read the values of the sensors that are attached to the Arduino Mega.
Process Datawill map the sensor values to the size of the graph automatically.
Graph Datawill display the mapped values on the graph.
All you have to know to be able to proceed with this project is a broad understanding onto how things are positioned on the TFT LCD, this is explained below.
I refer to the whole LCD as the canvas, this is where everything is drawn, all TFT LCD libraries work quite similarly, so the functions in this code should also work with other libraries. Below is a sketch of a quadrilateral (a rectangle) being drawn on a TFT LCD.
In this sketch, a rectangle is drawn, each point is labelled, the line of code that is used to draw a rectangle is this,
tft.fillRect(originX, originY, sizeX, sizeY, Colour);
originXis represented by 'z' on the diagram above, this is the distance from the right of the screen to the shape.
originYis represented by 'x' on the sketch, this is the distance form the top of the screen to the shape.
sizeXis the size of the shape on the x axis, this is the length of the shape.
sizeYis the size of the shape on the y axis, this is the height of the shape.
The user operating this project will benefit in:
- Drawing a bar chart on a TFT LCD
- Doing so in seconds
Step 1: Required Apparatus
I have designed this example using two potentiometers, though one could use any sensor(s) for the graph. Here is the list of materials.
- 1, Arduino Mega
- 1, Breadboard
- 2, Potentiometers
- Jumper Wires
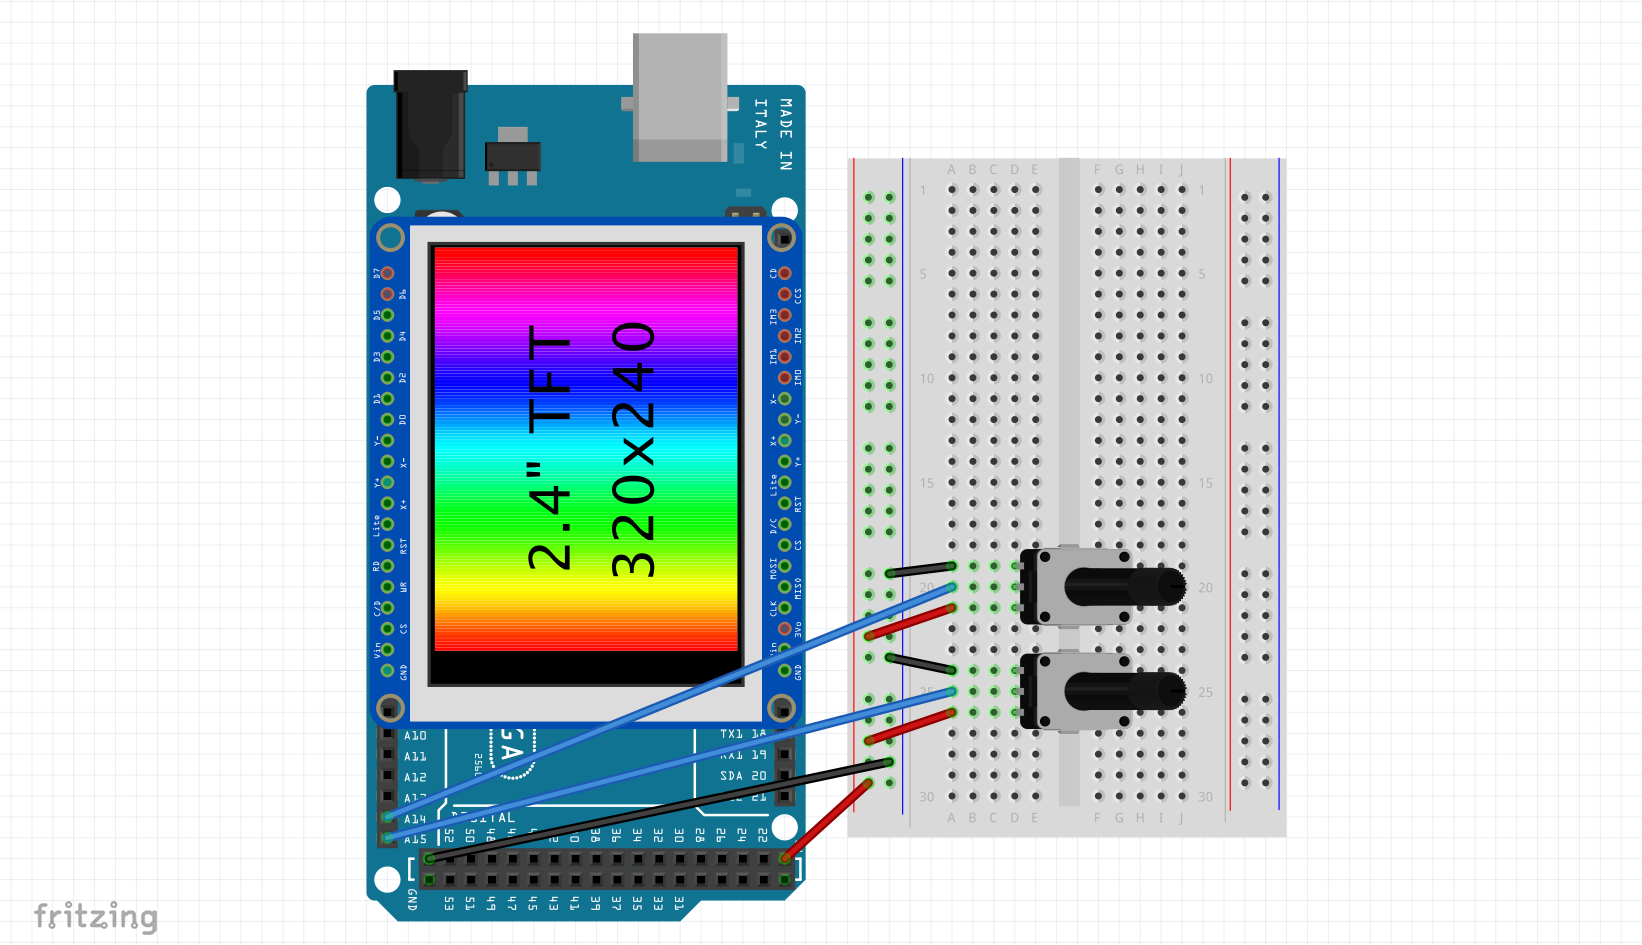
Step 2: Connecting the Circuit
The schematics below show how the circuit is wired, just snap on the TFT LCD and connect the potentiometers.
Step 3: Acknowledging the Code
There are three main parts to the code:
- Set Up Graph
- Read Sensor Values
- Draw Graph
These sections are explained below.
- Set Up Graph
// draw title
 tft.setCursor(10, 10);
 tft.setTextColor(BLUE);
 tft.setTextSize(4);
 tft.println(graphName);
 // draw outline
 tft.drawLine(originX, originY, (originX + sizeX), originY, graphColor);
 tft.drawLine(originX, originY, originX, (originY - sizeY), graphColor);
 // draw lables
 for(int i = 0; i < numberOfMarks; i++)
 {
   tft.drawLine(mark[i], originY, mark[i], minorSizeY, graphColor);
 }
 // draw lable names
 for(int i = 0; i < numberOfMarks; i += 2)
 {
   tft.setCursor((mark[i] + 6), (originY + 10));
   tft.setTextColor(graphColor);
   tft.setTextSize(2);
   tft.println(graphBlock[i / 2]);
 }
 // draw numbers
 for(int i = 0; i < 6; i++)
 {
   tft.drawLine(originX, (originY - number[i]), minorSizeX, (originY - number[i]), graphColor);
 }
This section of code will draw each feature of the graph using the given parameters as well as the automatically calculated ones, the title of the graph is drawn, then the outline and then the x and y axis are labelled.
- Read Sensor Values
// get the values of the sensors
 valueBlock[0] = analogRead(A14);
 valueBlock[1] = analogRead(A15);
 if(proDebug)
 {
   Serial.println(valueBlock[0]);
   Serial.println(valueBlock[1]);
   Serial.println("");
 }
 // map the sensor values to the graph size
 for(int i = 0; i < numberOfBlocks; i++)
 {
   posBlock[i] = map(valueBlock[i], 0, graphRange, originY, (originY - sizeY));
 }
This code will read the sensors attached to pins A14 and A15, then the results will be mapped according to the size of the graph.
- Draw Graph
// draw the blocks - draw only if value differs
 for(int i = 0; i < numberOfBlocks; i++)
 {
   if(posBlock[i] > (prevPosBlock[i] + 2) || posBlock[i] < (prevPosBlock[i] - 2))
   {
     prevPosBlock[i] = posBlock[i];
     tft.fillRect((mark[i * 2] + 1), (originY - sizeY), (boxSize - 1), sizeY, WHITE);
     delay(10);
     tft.fillRect((mark[i * 2] + 1), posBlock[i], (boxSize - 1), (originY - posBlock[i]), blockColor);
   }
 }
The last section of the code will draw the blocks/bars of the chart, this whole section is flexible as well as the others and can adapt to the user's preferences, learn to set them up in the next section.
Personalising the Graph
It is nice to have a graph that displays two potentiometer values, but I am sure that everyone wants to display their own values on the graph, anything from temperature to solar radiation, using 1 block or maybe 4, well that is as easy as editing a variable. The fallowing variables are all you have to edit.
bool proDebug = 0;
bool displayValues = true;
uint16_t graphColor = BLUE;
uint16_t blockColor = GREEN;
String graphName = "Bar Chart";
String graphBlock[] = {"Pot1", "Pot2"};
int graphRange = 1024;
int numberOfBlocks = 2;
proDebugenables printing to the serial monitor, its default position is 0 (off), when turned on (1/true), the device requires the serial monitor to be open, it then prints values to the serial monitor, ideal for troubleshooting.
displayValuesregulates if values should be displayed for each bar or not, when turned on, the value of each sensor is displayed at the bottom of each block, defaults to true.
graphColorsets the colour of the graph, the lines and numbers on the x and y axis will be displayed in the selected colour.
blockColoursets the colour that the blocks/bars of the chart are displayed in.
graphNamesets the name of the chart, this is displayed at the top of the graph in blue.
graphBlocksholds the names of each of the blocks/bars on the graph.
graphRangeis the highest number that the sensor can output, this number is essential for the graphing and must be set correctly, if you want to display a Raw Analog pin's value, like the potentiometer, set it to 1024, the max value of an Analog pin. If you are using a sensor that outputs a gestured value, like a temperature sensor, you could set the value to a high number like 50. (Note that the chart has not been tested with negative numbers)
numberOfBlocksrepresents the number of blocks that are needed in the chart, ensure that this number is equal to the number of elements in the stringgraphBlock[].
All of the other values are calculated automatically which gives you less time to worry about the code and more time to enjoy the graph.
Adding Values
Fallow the guide below to get an in-depth on how to add or subtract a block and edit the value that the block displays.
Going Further
You can go further experimenting with the project, try editing the originX, originY, sizeX and sizeY constants to give your graph a different size and position on the screen. There is a header file attached to the main sketch, it contains the colour codes of some colours, try changing the colour of the chart and the bars. And that is it, your personalised graph is ready.
Libraries
- Elegoo Libraries - Copyright (c) 2012 Adafruit Industries under the BSD License.
I was browsing the web for some inspiration and found that there are no projects for graphing on a TFT LCD, not on the one I am using anyway. So I started building one from scratch, then decided that I should give it an interface that allows the whole chart to be adapted to any number of sensors by only editing a small amount of variables, and so I got busy with the math and got this project done. This way one won't have to rewrite the code over and over again if one wants to chart other data, (saves space on iCloud).


_wzec989qrF.jpg?auto=compress%2Cformat&w=48&h=48&fit=fill&bg=ffffff)


Comments
Please log in or sign up to comment.