


Hardware components | ||||||
 |
| × | 1 | |||
 |
| × | 1 | |||
 |
| × | 1 | |||
Software apps and online services | ||||||
 |
| |||||
| ||||||
| ||||||
Ever felt burdensome to keep a check on temperature of a facility or plant? Keep reporting the highs and the lows. Well, imagine it is automated. You can just sit and have a cup of tea. Let IoT do the job for you.
This project demonstrates a Refrigerator's temperature monitor and also detects anomaly if found. It alerts you via Telegram if the temperature inside falls too low or it is higher than it should be. It also alerts if someone opens the refrigerator's door. This is done using Z-Score analysis. If your temperature is critical it alerts you and you can predict the temperature that would be after a certain time, thus helping you make your decisions better. It can be implemented to any plant, facility that requires temperature monitoring. Let's dive into it.
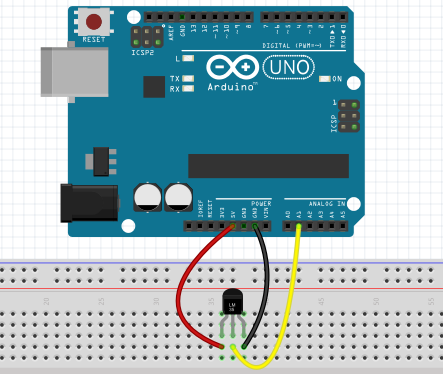
Connections:Now that you have made the connections and registered the product on cloud, it's time for taking inputs.
Connect the module to power supply using an adapter or Power Bank and place it on the refrigerator. Keep the sensor inside the refrigerator.
Now, record the readings of the sensor for 2 hours to get the gist of the temperature values in there. We'll then set the thresholds accordingly.
Plotting and PredicitonOnce you finish taking readings the graph would look somewhat like this below.
Now play with the predicted points, coefficients and frame size and predict until you get a graph that shows similar behavior (like the one below).
We can see the temperature constantly (more or less) remains between 0-5 degree Celsius. So, our minimum threshold is 0 degree Celsius and maximum threshold is 5 degree Celsius.
Configuring scenario in IntegromatNow alerts are carried using Integromat.
- Create a New Scenario of Webhooks and Telegram.
- Set the schedule mode to trigger.
- Copy the Webhook URL to your code.
- Create a new Telegram Bot.
- Search 'BotFather' in telegram
- Send '/newbot' and create a new bot. Choose bot name.
- On successful creation a AUTH_TOKEN will be generated.
- Now create a new channel in Telegram App and add your Bot to it assigning it all permissions.
- Click on Telegram in Scenario and choose 'ADD' in connection
- Give a name and enter the AUTH_TOKEN
- Enter the chat ID of channel you've created in Chat ID
- Enter the text message as below.
- Turn the Scenario ON
It's a good practice to store your credentials, API, etc. in a different file.
So, we'll create two Python files. viz. conf.py and fridge_alert.py
Now the stage is set, Let's run our code and see the output.
Simple! isn't it?


Comments
Please log in or sign up to comment.