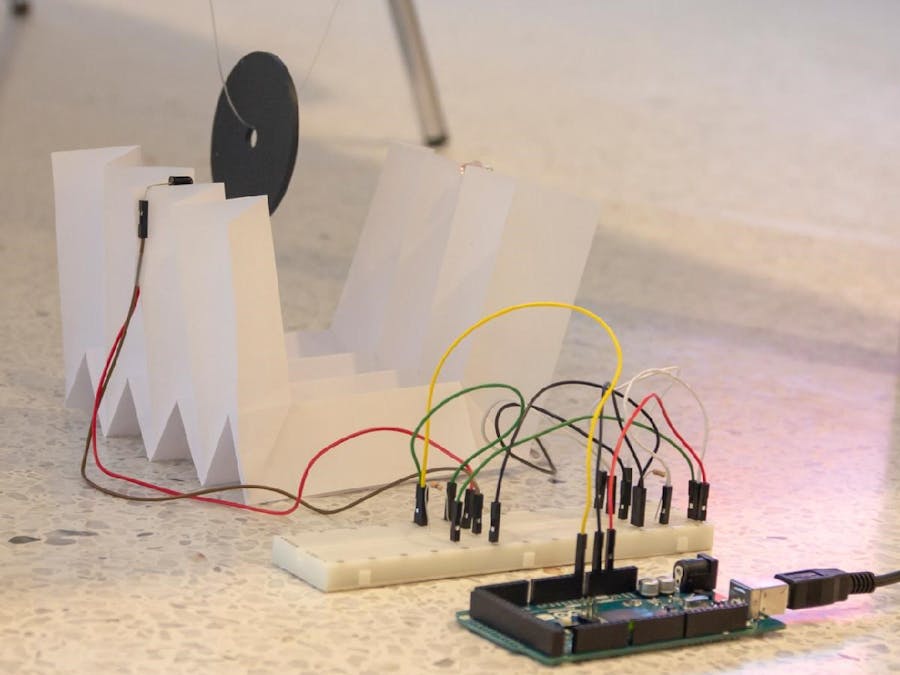
This video shows how to make the photo-gate origami structure.
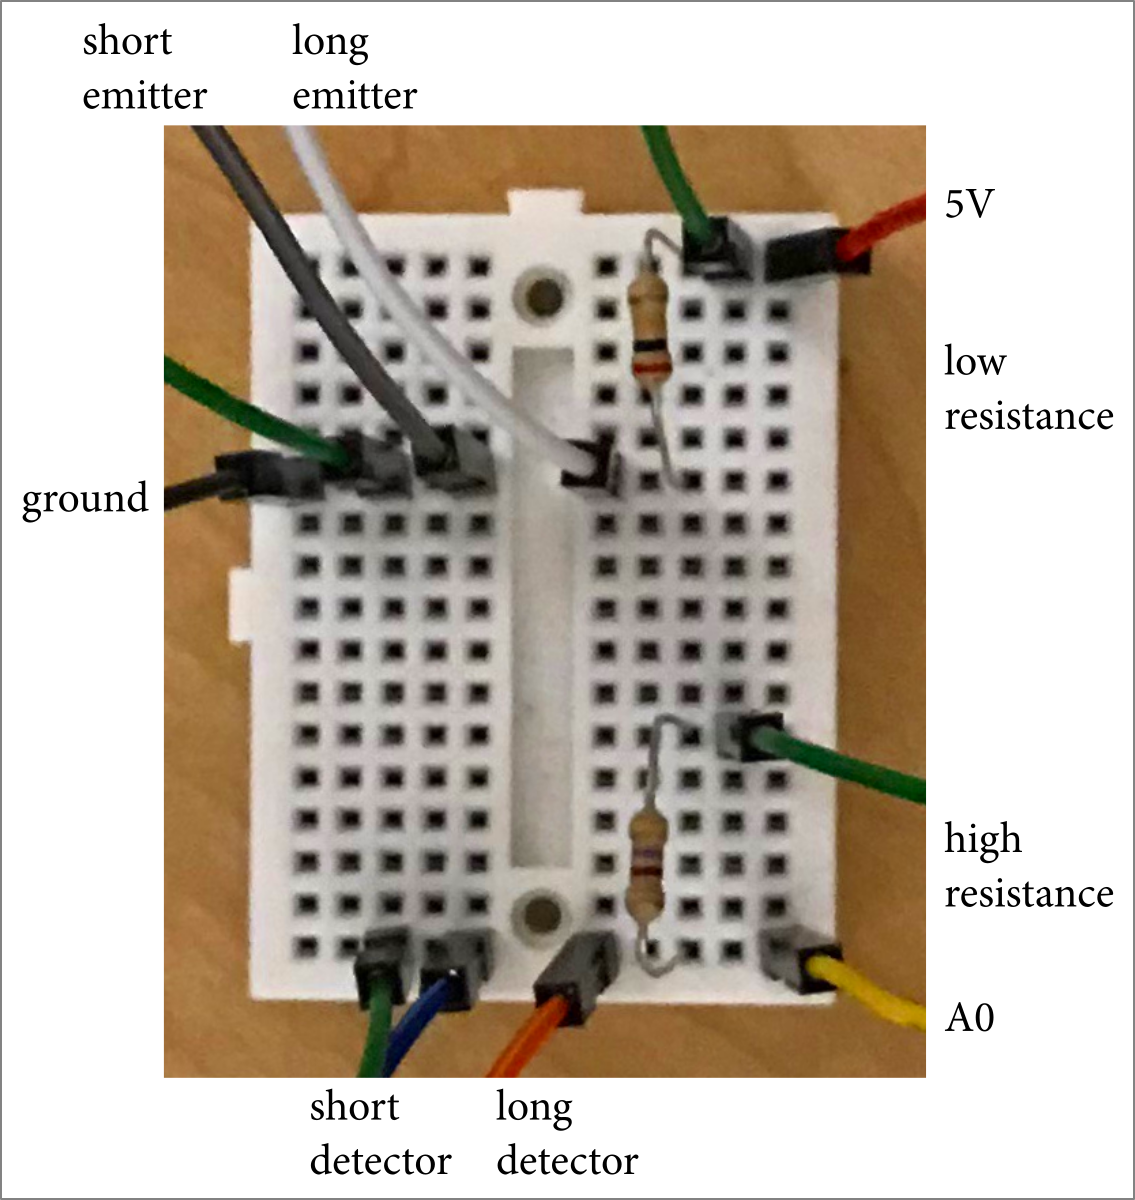
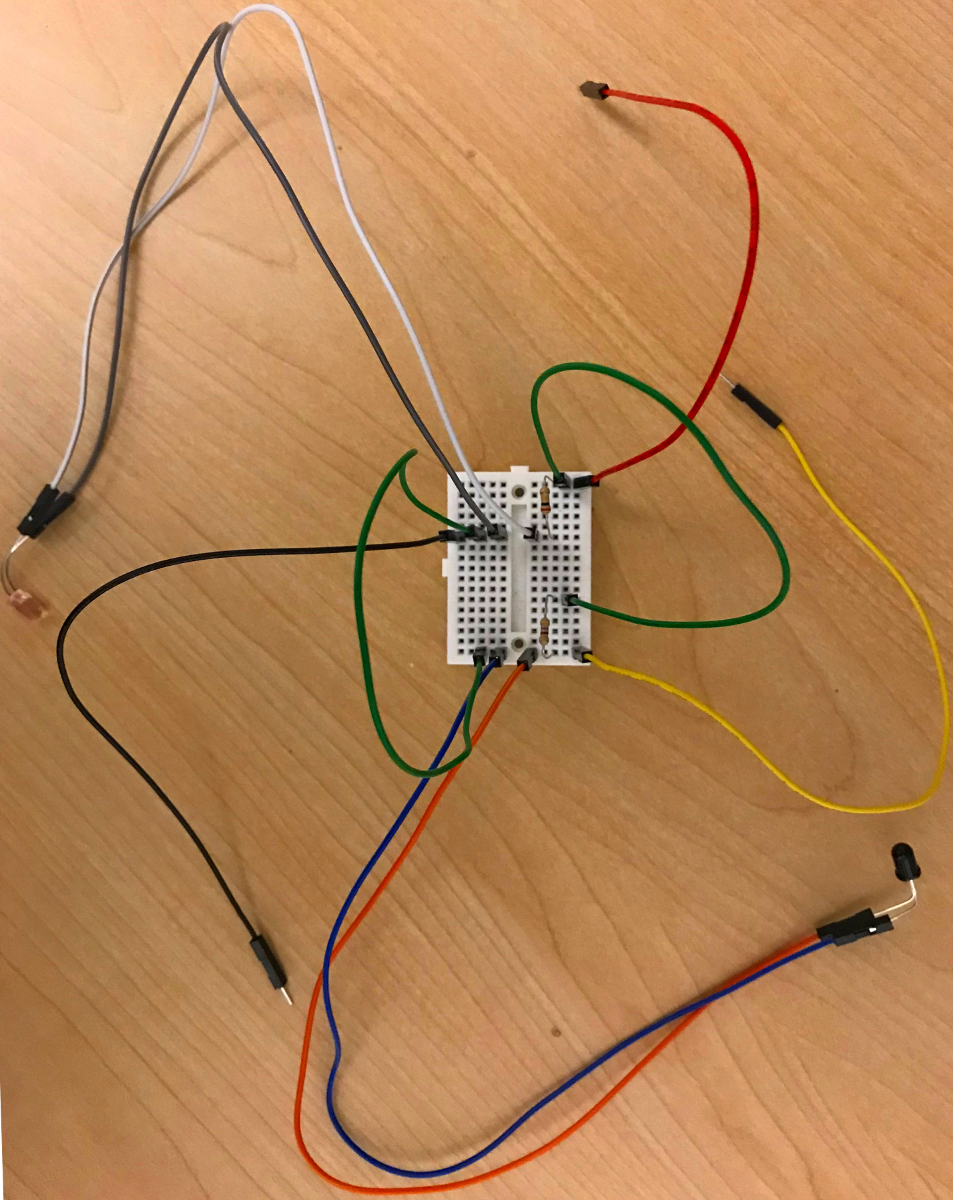
Refer to the schematics section for building the circuit.
How to Run This Project in MATLABYou can download this project from the File Exchange and run it directly in MATLAB.
Acquiring and Analyzing DataConnect MATLAB® to the Arduino®
a = arduino()
If you see an error message, you may have already connected MATLAB to an Arduino by running the code more than once. You can simply ignore the error message and continue.
Specify the data pin on the Arduino (yellow wire in the schematic).
photogatePin = 'A0';
Define the number of samples to read.
numSamples = 2^10;
Initialize an empty vector for collecting voltage data.
v = zeros(1,numSamples)
Set the pendulum swinging and read the voltage in a loop.
Time how long it takes to read numSamples with tic and toc, which returns results in units of seconds.
tic
for s = 1 : numSamples
    v(s) = readVoltage(a, photogatePin);
end
clockTime = toc
If you do not have an Arduino, but would like to follow along with the rest of this project, load the set of example data by uncommenting and running the following code:
% load data.mat;
The time vector is
t = linspace(0,clockTime,numSamples);
Plot the voltage time signal.
plot(t,v);
xlabel 'time (s)';
ylabel 'voltage (V)';
To find the period of the pendulum from the voltage signal, find the peak to peak time differences.
First find the high points by thresholding the voltage by defining a logical vector
isHigh = v > mean(v);
then use the vector to logically index into t and v.
tHigh = t(isHigh);
vHigh = v(isHigh);
Plot the results.
plot(t,v,'.-',tHigh,vHigh,'o');
xlabel('time (s)');
ylabel('voltage (V)');
Compute the time between high point samples and display the set's histogram. If the pendulum swing is slow enough, you may have multiple samples in a row that read as high points. Zoom into the voltage signal plot above to see this.
dt = diff(tHigh);
histogram(dt);
xlabel('dt');
ylabel('count');
The first peak in the histogram is made up of samples within a single peak. The other bins are made of samples across peaks. Threshold the dt samples based on your observation of the histogram to identify the samples across peaks.
dtThreshold = 0.3;
The logical vector that picks out the elements of dt that form the gaps across peaks is
isGap = dt > dtThreshold;
The elements of tHigh that are on the falling edges of the peaks are
isEdge = [isGap false];
where we appended false to isGap to account for the last peak, which has no peak after it to form a gap (or valley). The t, v values of the falling edges of the peaks are therefore
tEdge  = tHigh(isEdge);
vEdge  = vHigh(isEdge);
plot(t,v,'.-',tEdge,vEdge,'o');
The time differences between the falling edges of the peaks are
dtEdge = diff(tEdge);
Check a histogram to see if it is physically valid to talk about a mean peak-to-peak time, i.e. if it is gaussian.
histogram(dtEdge);
xlabel 'peak-to-peak time (s)';
ylabel 'count';
The period of the pendulum is the time it takes to complete a full swing, which includes
- breaking the photo-gate going in one direction
- breaking it going in reverse
- breaking it going in the original direction,
to form a total of 3 peaks. So, the period is twice the measured mean peak-to-peak time.
T = 2 * mean(dtEdge)
The pendulum's period and length are related to the acceleration due to gravity by
so knowing the pendulum's period and length,
L = 0.62; % units of meters
we can find the acceleration due to gravity according to
g_value = (2*pi/T)^2 * L % m s^-2


_3u05Tpwasz.png?auto=compress%2Cformat&w=40&h=40&fit=fillmax&bg=fff&dpr=2)
Comments
Please log in or sign up to comment.