When you've finally found you need a debugger, and you're not sure which one to get, there is always the option of making your own from an existing board to at least try it out...
Here we debug our Arduino Nano 33 BLE with an STM32 Blue Pill board converted into our Black Magic Probe. We can then add some custom entries in Visual Micro to configure this debugger before appears as standard (coming soon).
Don't worry about your Blue Pill board to being a debugger forever, see the Undo section at the bottom to return it back to normal.
NOTE - This will get debugging working, but we would recommend buying a purpose built Black Magic Probe for critical applications, which are competitively priced.
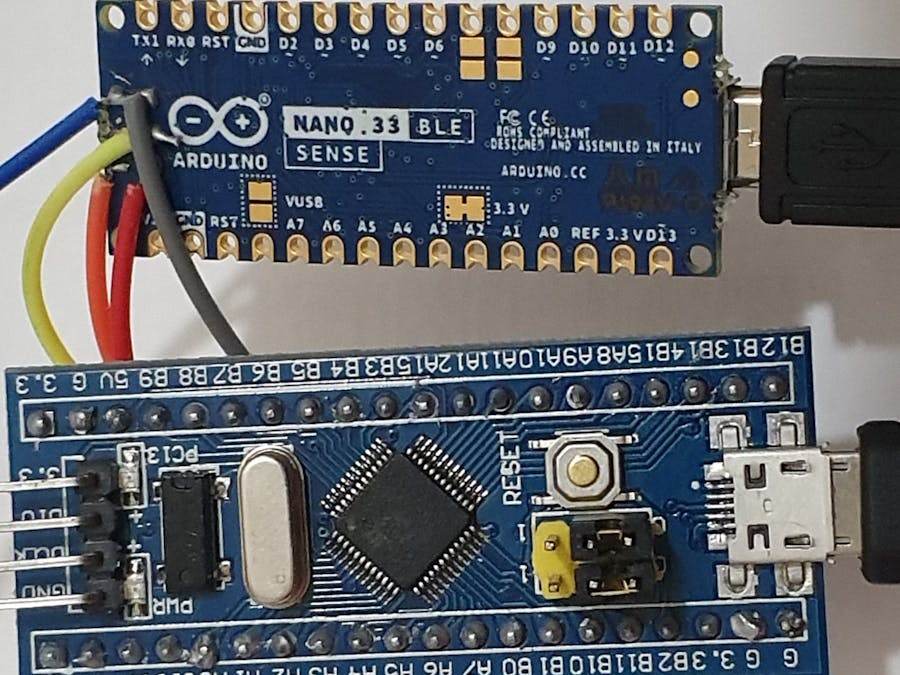
Soldering the Nano 33Before we can connect our Nano 33 BLE board to our external debugger, we will need to connect some jumper wires onto the pads on the back of the board as shown here:
Now we can setup our STM32 board as a debugger, using the STLink Flasher Tool to flash the firmware onto the board.
Here we will use the GUI as it is easiest to walk through, and we will use pre-compiled images to save having to build them ourselves.
1) Download BMP STLink DFU Pre-Compiled BIN files from these links:
http://builds.blacksphere.co.nz/blackmagic/blackmagic-stlink.bin
http://builds.blacksphere.co.nz/blackmagic/blackmagic_dfu-stlink.bin
2) Set Boot 0 Jumper to 1 (red jumper in image for clarity)
3) Connect Board to PC using FTDI Adapter:
NOTE: Swap to 3.3v ifneeded with 3.3 pin to right of Gnd
4) Run Flash Tool Installation and Open the "STMFlashLoader Demo" application
- COM Port, Baud 115200
- Review detected flash size for safety, press Next
If your board shows as 64K this may not work!
(as we have > 80KB to upload), and could damage your board.
There is a possibility it will work (it did for us without any issues)
- Select 128K Flash Size (if only 64K this *may* work, or brick board!)
- Select Download and locate blackmagic_dfu-stlink.bin File
- Set start address 0x8000000
- Select Verify
- Run
Optional: move BOOT0 Jumper back to 0, re-plug USB and check it shows as Upgrade in Device manager if desired:
5) Ensure BOOT0 Jumper is back to 1, and board reset before repeating for next image, repeating same steps as above, but with a different image file, and start address:
use image file blackmagic-stlink.bin
Start Address 0x8002000
6) Move BOOT0 Jumper back to 0 (now green jumper for clarity)
7) Disconnect FTDI adapter from Blue Pill board
8) Connect Blue Pill to PC via USB Cable Only using its on-board USB-micro port.
You should now see two new COM ports appear (and an additional 2 devices in device manager):
NOTE - No Additional drivers are needed for this Debugger, so no changes via Zadig will be needed
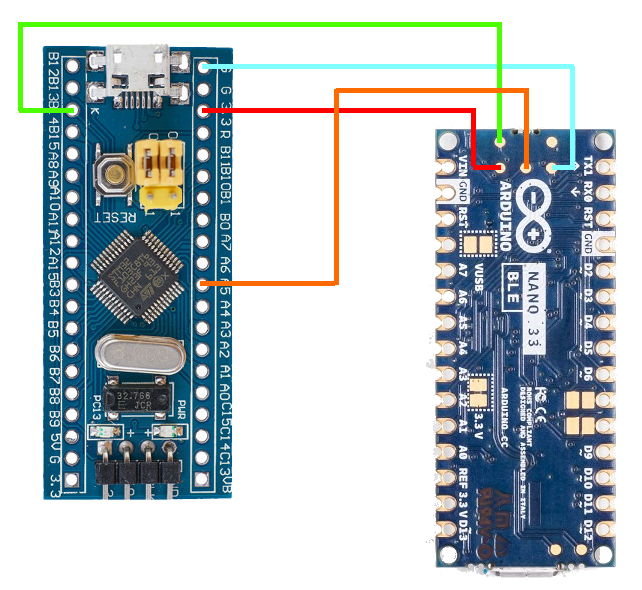
Connecting Debugger and TargetAs the Nano33 BLE harnesses the SWD protocol for debugging, we only need to connect 4 wires as shown below:
Now we have our hardware connected, we can add in the custom entries for Visual Micro to allow us to use this debugger, before it has been added to the menu as a default option.
Open your project and select the Arduino Nano 33 BLE board, and its COM port.
Right click on the project and select "Add Custom GDB Debugger (Advanced)"
This will automatically add a boards.txt and a ARDUINO_NANO33BLE.Debug.debugger_launch.json to the project which allow further customisation of the debugging tools in Visual Micro.
Editing the Launch JSONOpen the JSON file from the solution explorer.
As we want to customise our debugger to use the Black Magic GDB Setup, we will need to edit two values:
MIDebuggerPath
This needs to reference your particular tool chain's GDB exe, which can be found by enabling vMicro>Compiler>Show Build Properties and Building your program.
Then Search in the output window for "runtime.tools.arm-none-eabi-gcc.path", and you should see something like the below:
runtime.tools.arm-none-eabi-gcc.path=C:\Users\Simon\AppData\Local\arduino15\packages\arduino\tools\arm-none-eabi-gcc\7-2017q4
This needs to go into our JSON, but we need to escape all "\" with "\\", and add "\\bin\\arm-none-eabi-gdb.exe" to the end of this, resulting in our JSON having:
"MIDebuggerPath": "C:\\Users\\Simon\\AppData\\Local\\arduino15\\packages\\arduino\\tools\\arm-none-eabi-gcc\\7-2017q4\\bin\\arm-none-eabi-gdb.exe",
So now we have our ARM GDB path configured, on to the parameters...
MIDebuggerArgs
This line can be replaced as below, just amend the COM port number as needed for Interface 0 of your Black Magic Probe.
"MIDebuggerArgs": "-nh -b 115200 -ex \"target extended-remote \\\\.\\COM24\" -ex \"monitor swdp_scan\" -ex \"attach 1\" ",
That is all that needs changing in the JSON, and no Edits to board.txt are needed (complete JSON example is attached in the files)
Debugging SetupNow we are all set up we start debugging straight away.
Now set the debugger to "Hardware"
Select the Manual/Custom option to use our Launch JSON
Ensure the vMicro > Debugger > Optimisation is set to "No Project + Libraries".
Add a break point in where you want to stop initially, these can be moved once you have started the debugger, and there is often a limit of 6 concurrent breakpoints.
Now Build & Upload your code via the Nano COM port.
Then select Debug > Attach to process to attach the debugger. You can also do this in one step by simply pressing Debug > Start Debugging.
Tip: This is the same process for other boards which can use the Black Magic probe such as the Arduino Nano 33 IoT for example.
UndoIf you want your Blue Pill back as it was, simply re-flash it to a standard Blue Pill again, as in this documentation, or using the same Flash Loader process used in this tutorial, with sector 0x8000000.
Learn More


Comments
Please log in or sign up to comment.