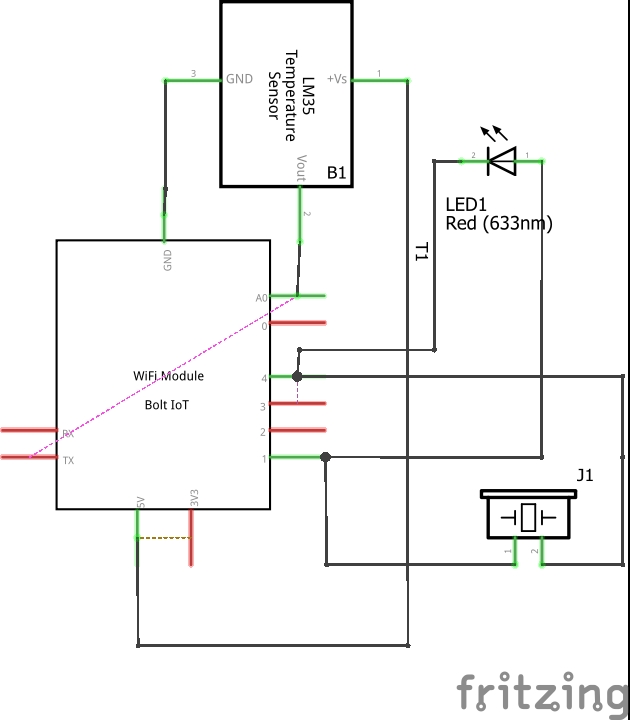
This project is a temperature monitoring system
1. It monitors the temperature of the room and sends email alert to the user if the temperature crosses the threshold limits(max and min).
2. It predicts the future temperature value by carrying polynomial regression.
3.Sends email alert to the user when there is an sudden change in the temperature by carrying z-score analysis.
Temperature monitoring systems are incredibly useful tools to monitor and manage heat levels
Now a days temperature monitoring is required in every industries, pharmacy etc
Due to improper monitoring of temperature in pharmacy companies, there are are huge loss of medicines so this system is developed to overcome the problem of every pharmacy companies, it sends email alert to the user if the temperature of the room reaches beyond the certain limit.
Not only for pharmacy companies, this system can also be used in any cases where we have to maintain a temperature with in the range.
The temperature of the place can be monitored through internet using internet of things. In this project LM35 sensor is used to sense the temperature.The system will continuously monitor the temperature condition of the room and the data is stored in the cloud.In this project I used Bolt wifi module to process the data and Blot cloud to store it
Working of LM35 sensor
LM35 sensor, senses the temperature of its environment and based on it's value it generates an analog output voltage. This analog voltage produced by the LM35 is then given as input to the Bolt A0 pin. The Bolt then converts the analog value into a 10 bit digital value that varies from 0-1023. This digital data is sent to the cloud via Bolt device.
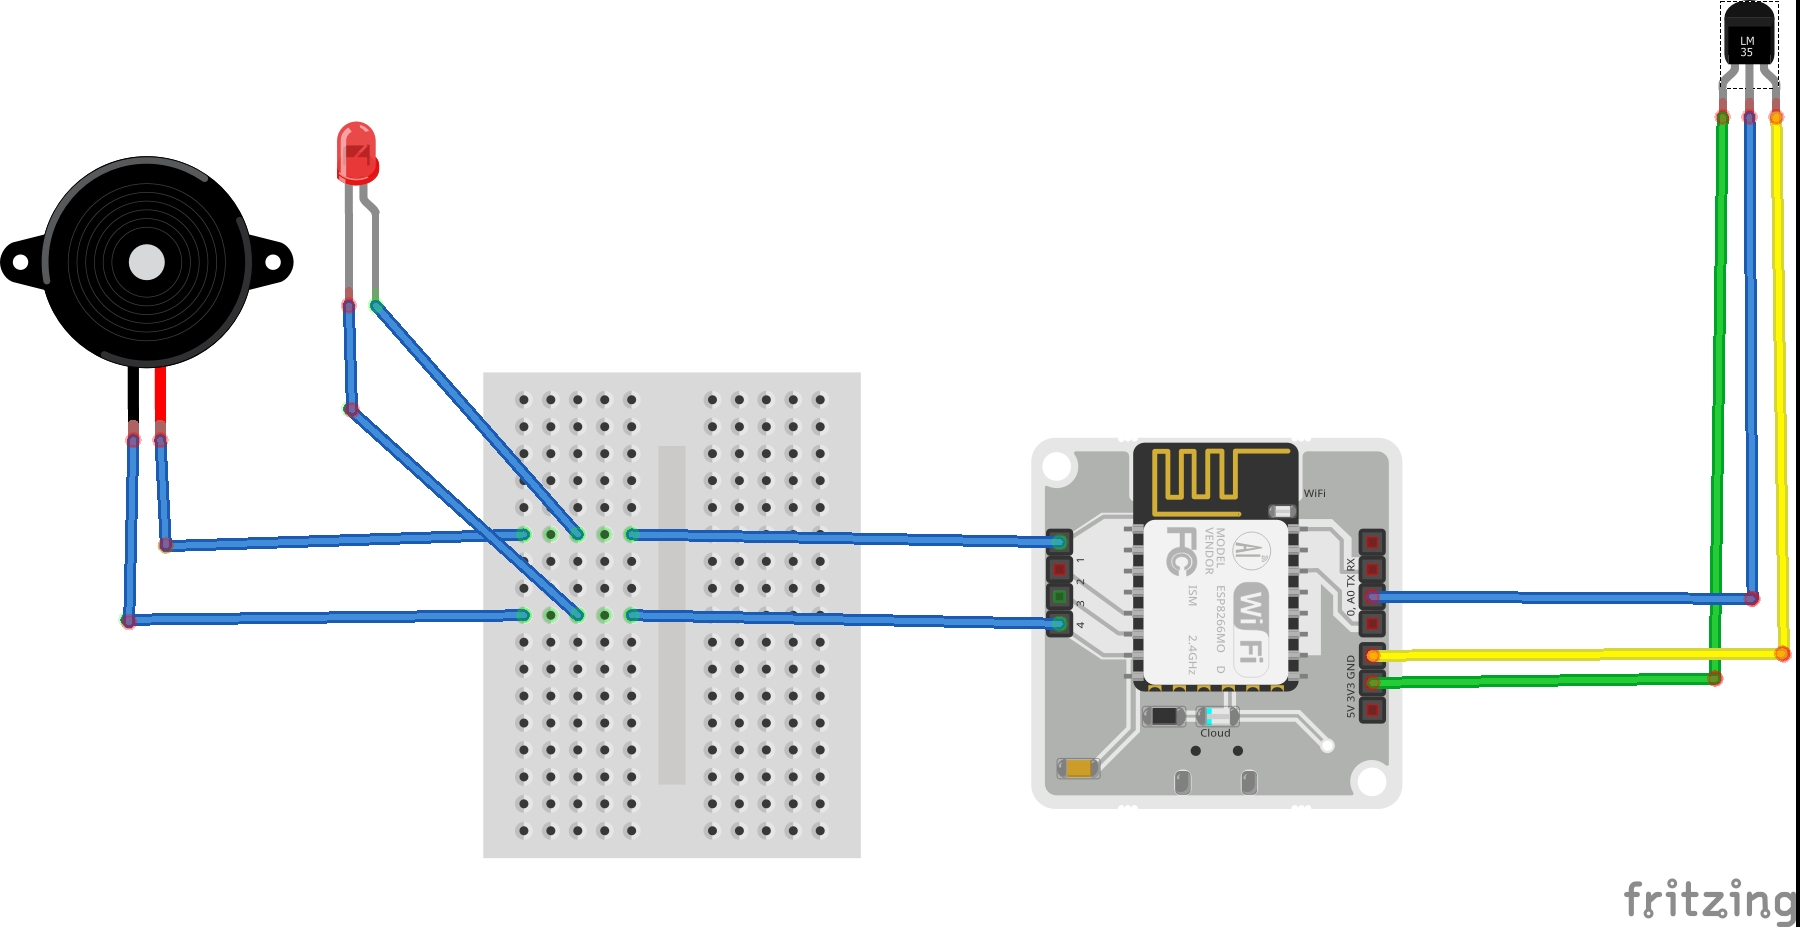
Circuit connectionsConnecting the LM35 sensor to the Bolt
1. Hold the sensor in a manner such that you can read LM35 written on it. 2. In this position, identify the pins of the sensor as VCC, Output and Gnd from your left to right.
VCC is connected to the green wire, Output is connected to the blue wire and Gnd is connected to the yellow wire
3. Using male to female jumper wire connect the 3 pins of the LM35 to the Bolt Wifi Module as follows:
VCC pin of the LM35 connects to 5v of the Bolt Wifi module. Output pin of the LM35 connects to A0 (Analog input pin) of the Bolt Wifi module. Gnd pin of the LM35 connects to the Gnd
Connecting Buzzer and LED to the bolt via bread board
Buzzer is connected to GPIO pin
+ ve terminal is connected to GPIO pin 1
-ve terminal is connected to GPIO pin 4
LED
+ ve terminal is connected to GPIO pin 1
-ve terminal is connected to GPIO pin 4
After the circuit connections following steps are done.
Step 1: Linking the product to the bolt device
Go to https://cloud.boltiot.com/ and then follow the steps below:
* Create product https://docs.boltiot.com/docs/adding-a-product
*Writing code for controling device https://docs.boltiot.com/docs/using-custom-filesin-your-product
*Link device to product https://docs.boltiot.com/docs/link-device-to-a-product
Step 2: Write a code in javascript to carry out the polynomial regression
setChartLibrary('google_chart');
setChartTitle('Pharma Monitor');
setChartType('predictionGraph'); (plots the prediction graph based on polynomial regression analysis)
setAxisName('Time','Temp');
mul(0.097); (converts the sensor input value to output temperature in degree celcius)
plotChart('time_stamp','temp');
Step 3:Sign up to the mailgun
Step 3.1: Open https://www.mailgun.com/ in browser.
Step3. 2: Click on Sign Up button
Fill all the necessary details in SIGN UP form.
Generate mailgun API key,sandbox url and senders email
Step 4: Login to the Ubuntu via virtual machine VMware
After successful login, create a file named email_conf.py which will store all the credentials related to Mailgun.
To create a new file type sudo nano email_conf.py in the terminal.
MAILGUN_API_KEY = 'This is the private API key which you can find on your                                 Mailgun Dashboard'
SANDBOX_URL= 'You can find this on your Mailgun Dashboard'
SENDER_EMAIL = 'This would be test@your SANDBOX_URL'
RECIPIENT_EMAIL =  'Enter your Email ID Here'
API_KEY = 'This is your Bolt Cloud account API key'
DEVICE_ID = 'This is the ID of your Bolt device’
FRAME_SIZE=10
MUL_FACTOR=6
The API key and Device ID of the Bolt module can be determined as follows:
Connect your Bolt Device to the Bolt Cloud as per instructions given at https://cloud.boltiot.com/.
Step 5: Create an new file named buzzer.py which contains main code to collect the data from the Bolt and send Email if it crosses the threshold and carry out Z-score analysis.
Step 6: Time to run the code. To do so type ‘sudo python3 buzzer.py` in terminal
Steps for writing the python code (buzzer.py):
STEP 1: In the code, first import the conf file which has all the credentials. Bolt python library which will fetch the data stored in Bolt cloud. The email library is also imported to send email alerts and Bolt is used for accessing data from bolt devices. The python JSON and time libraries are also imported. The math and statistics libraries will be required for calculating the Z-score and the threshold boundaries.
STEP 2: Now initialize a variable that will store the maximum and minimum threshold value. This would send an alert if temperature goes above the maximum limit and below the minimum limit
STEP 3: Z-score calculates the boundaries required for anomaly detection.This function takes 3 input variables: history_data, frame_size and factor and checks whether enough data has been accumulated to calculate the Z-score, and if there is too much data, then the code deletes the older data.
STEP 4: Calculates the means(Mn) and variance value of the collected data points.
STEP 5:Here we calculate the Z score (Zn) for the data and use it to calculate the upper and lower threshold bounds required to check if a new data point is normal or anomalous.
STEP 6: To fetch data from Bolt cloud, create an object called ‘mybolt’ which can access the data from Bolt. For the Bolt Cloud to identify the bolt device, provide the API key and the Device ID when creating mybolt object. To send an email, create an object of the same.
STEP 7: To continuously monitor the temperature reading, enclose the logic to fetch, compare and send the email inside an infinite loop using the ‘while True:’ statement.
STEP 8: The led and buzzer system is run by the ‘digitalWrite’ function, connected to the D4 pin of Bolt.
STEP 9: The code fetches sensor value using ‘analogRead’ function which is connected to the A0 pin of Bolt.
STEP 10: The response from the Bolt cloud using the analogRead() function is in JSON format, so load the JSON data sent by cloud using Python’s JSON library.
STEP 11: The sensor value is inside a field labeled as “value” in the response. Access the JSON values using the statement ‘sensor_value = int(data[‘value’])’. This line also converts sensor reading to integer datatype.
STEP 12: This is enclosed inside a try-except block to handle any error that may occur in the code.
STEP 13: The next line of code checks if the sensor reading is with in the limit or not. If it exceeds, then email will be sent.
STEP 14:If the above statement is true then digitalWrite() is executed on the D1 pin of the Bolt, turning ON the led and buzzer.
STEP 15:The email to be sent containing the text “The temperature exceed the threshold limit” followed by sensor reading.
STEP 16:The response from mailgun will be stored inside the ‘response’ variable.
STEP 17: The status of the message is printed on the console.
STEP 18: The statement ‘time.sleep(10)’ puts the program execution on hold for 10 seconds.
STEP 19: The next line code shows the z-score analysis to turn on the led and buzzer using digitalWrite() function when the temperature crosses the the limit set by z-score analysis.
STEP 20: The mail sent to the user which contains the text “Someone has opened the door.”
STEP 21: The statement ‘time.sleep(10)’ puts the program execution on hold for 10 seconds
Applications of this system.
1. Monitor the temperature of the room by setting the threshold temperature values.It sends email alert to the user when the temperature exceeds the threshold temperature.
Email-“Temperature has reached above threshold value”
Examples :cold storage, pharmacy buildings,etc
2 .It carries Z-score analysis and based on input values it sets the threshold values.It also sends email alert to the user when the temperature has dropped suddenly.
Email –“someone has opened the door”
Examples: Refrigerator door system
3. It carries polynomial regression analysis, which helps in predicting the temperature data.
WorkingPrediction of temperature
I have used Polynomial Regression Algorithm of Machine learning, which helps fit a non-linear curve to a given data-set. The trend can be then used to understand where other data points might lie.
The predicted data points are calculated based on:-
The prediction points tells the visualizer how many future data points need to be predicted
Temperature monitoring by setting boundaries:-
A code in python is written to monitor the temperature of the room
The maximum and minimum threshold values are set in the program, based on these provided program it compares the input sensor value with the threshold range.
If it crosses the range then it sends email alert to the user.
Email alert
Anomaly detection by Z-score analysis
Z-score analysis is used for anomaly detection. Anomaly here means a variable's value (temperature of the surroundings) going beyond a certain range of values. The range of values is called bounds (upper bound and lower bound). These bounds are calculated using the input values, frame size and multiplication factor. The frame size is the minimum number of input values needed for Z-score analysis and the multiplication factor determines the closeness of the bounds to the input values curve.It basically works to detect any sudden change in the sensor value when someone opens the door of fridge the temperature suddenly changes and this anomaly when detected the alert message sent via Email to the user.
After 10 data points the Z-score analysis is carried and based on the mean value obtained it sets the threshold max and min values.
Formula to calculate threshold values based on z-score analysis.
where Mn is taken as mean Vi is variance and Zn as Z-score.. Frame-size & Multiplication factor are assigned values in separate.py file


.png?auto=compress%2Cformat&w=48&h=48&fit=fill&bg=ffffff)


Comments