What did we do?This is an autonomous beehive monitoring embedded system, which gets and sends data to a cloud server (Sigfox) so that the beekeeper can check it through an Ubidots dashboard.
Alerts are also sent to inform whether some relevant event happens in the beehive after analyzing the data from the different sensors.
About usWe are a group of 4 Embedded Systems Engineering students who worked on this project for our Embedded Systems Project module over a semester.
Stage 1: prototypeWe started off from a prototype on a bread board:
During this stage, we started off by documenting ourselves on the different sensors and adding them to our system.
For the temperature sensors that go inside the beehive, we used a different pin for each sensor. On the prototype, it was possible to use multiple of these on the same pin but separating them was easier for the PCB.
The scale needs to be set up with a known weight to determine the offset and scale factor in the code:
Scale setup, in setup() function
For the Sigfox module, the TX and RX pins have to be inverted with respect to the Arduino board.
Sharing data with the beekeepers
First, we use a sigfox module to send 3 bytes to the sigfox server.
We are limited to 144 messages per day, so we send one every 10 minutes.
Reception of messages on Sigfox
Each byte contains an individual parameters, we can send a maximum of 12 bytes.
A structure was constructed to facilitate the dispatch :
Data structure for the Sigfox callback
We have a specialized function to retrieve each data and store it in its own byte.
(External Humidity, Internal Humidity, Battery level, External Temperature, 3* Internal Temperatures, Weight, Luminosity and Audio prediction)
To optimize space, some of the data undergoes multiplication or other mathematical operations, then the result will be retrieved on Ubidots after the callback is made.
Beekeepers can monitor their hives on a Ubidots Dashboard. We display our data after treatment to retrieve the correct accuracy, for example temperatures are divided by 2 to have a 0.5°C accuracy.
The data can be seen on a choosen number of days specified by the calendar and in the form of graphs.
A brief example of our Dashboard’s presentation :
To understand the codes used in the audio prediction, an explication’s table is annexed next to the graph.
We have 5 labels :
- 11 → indicates an error
- 22 → The Queen’s chant, an indication of possible swarming
- 33 → Hive in a normal state
- 44 → Silence
- 55 → Someone is talking nearby
Sound analysis of the Beehive
One of the relevant data of our system is the sound analysis of the beehive. We achieved this analysis through a Classification IA developed on Edge Impulse.
We divided the training between 4 labels: silence, normal, voices and piping. Our best training came out with an overall 96% accuracy.
- Silence: 11 minutes of complete silence and very light white noise
- Normal: 3 hours and 30 minutes of bee sounds from the dataset To Bee or Not Bee
- Voices: 25 minutes of human voices (in French)
- Piping: 7 minutes of piping sounds. This sound is emitted by an emerging queen to signal its birth to the beehive. If the emerging queen gets a lot of response from other emerging queens, it might decide to leave the beehive with half the swarm (swarming).
The more data you can gather for each label, the most accurate the training and then the predictions will be. Some other labels relevant to a beehive could be distinguishing a beehive with a queen to a one without a queen, detecting the presence of an attack (ie: Asian hornet). Be creative in your data acquisition: Youtube samples, recording with your phone or with an adequate recording system, downloading open-source datasets… However your data should be of good quality and relevant to the label: yes, the quantity of data is important, but relevancy is crucial.
We followed the official Arduino tutorial for Edge Impulse with an Arduino Nano 33 BLE Sense.
Our sounds were not acquired using the internal microphone: we therefore had to downsample them to the microphone frequency (8kHz).
For the code, we modified the Example “nano_ble_33_sense_microphone” synthetized by Edge Impulse. For more accuracy of the data, we run the IA prediction 4 times, only keeping the most predicted label.
Consumption and optimization
To optimize the consumption, we used different techniques. First, we powered the card with a tension of 3.3 V. To do that, you must cut the 3.3V track as shown in the photo (track next to the “3.3V” label):
Board with the cut 3.3V track
However, now you need the battery to be connected for the card to power on.
In the code, we used the function delay which is optimized to put the card in sleep mode. During the 10 minutes we don’t use the card, the weight sensor is turned off to save energy. We also turned off the card’s green LED.
The average consumption on 5V mode and without the optimizations was 40 mA and is now 3.6 mA.
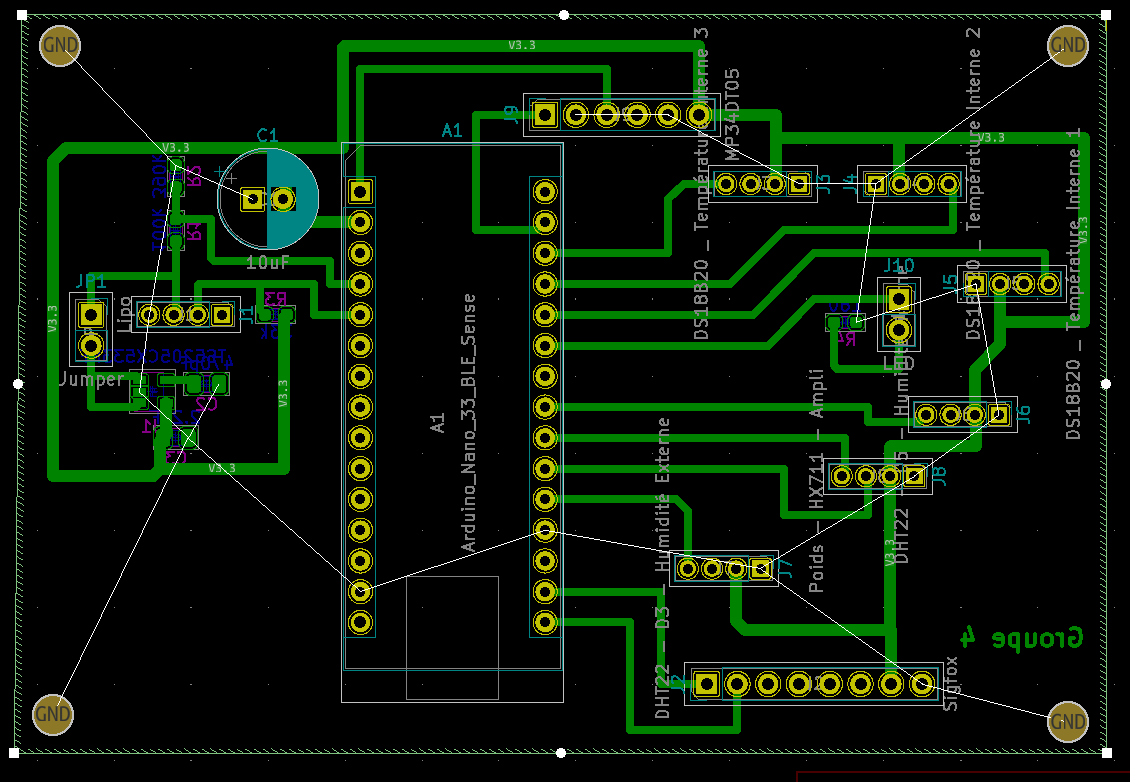
Stage 2: Printed Circuit Board
After the prototype, we created a PCB in order to miniaturize and improve the performances.
For this part, we used the software Kicad.
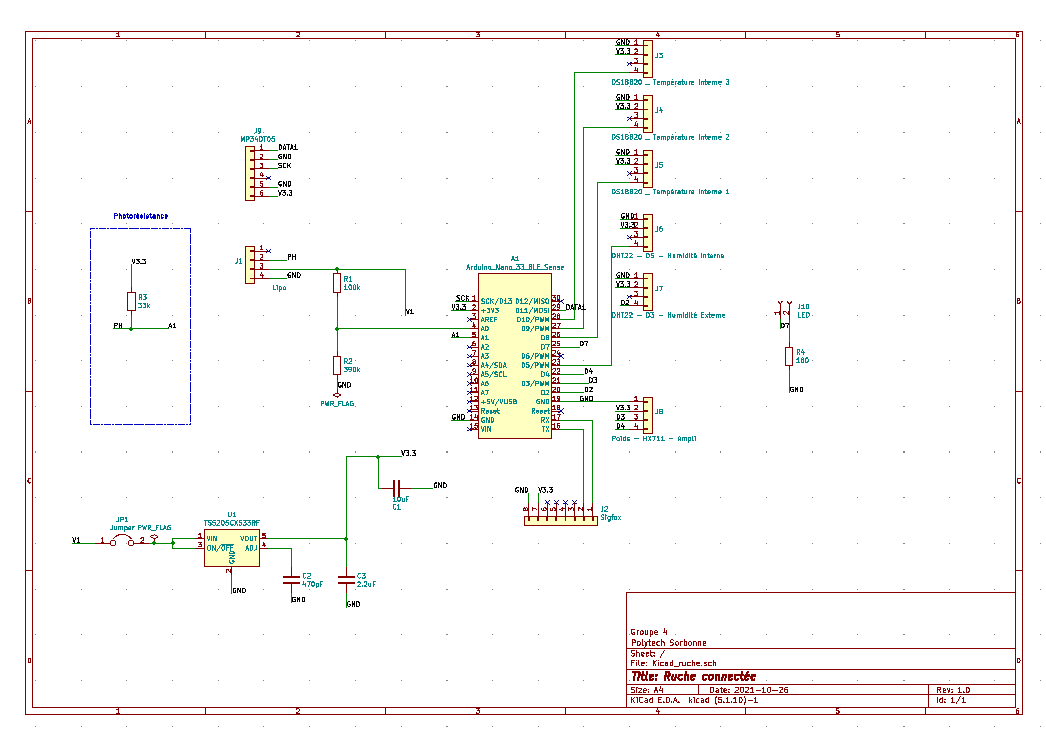
The electrical schematic
We created a project with Kicad and placed the components. The position doesn't matter since it was rearranged for the PCB’s routing.
The Nano 33 BLE Sense’s schematic was not available in the Kicad default libraries. Therefore, we created our own component with the help of the datasheet.
For all sensors and the Sigfox module, we used a generic connector pin header “conn_01x0Y” with Y the number of pins. A spacing of 2 mm is needed for the Sigfox module and a spacing of 2.54 mm for the grove connectors.
Since one of our goals is to optimize the consumption, we used an LDO (Low-Dropout Regulator) with 2 decoupling capacitors to have an output of 3.3 V. We added a jumper to connect or disconnect the battery, which delivers a tension between 3.7 V and 4.2 V.
We used a voltage divider to adjust the tension to a maximum of 3.3V in order to read it from the card.
The third capacitor of 10 µF is used to reduce the noise. We also used resistors for the LED and the photoresistor.
Routing
We used one layer for our PCB. We preferred miniaturized components. All the resistors and small capacitors are SMD. The big capacitor of 10 uF is a THT. We succeeded in making no jumps between junctions. The ground isn’t displayed for readability.
Stage 3: real-conditions testingMid-December 2021, we went to install our system on a real beehive to test in real contions for a few weeks.
Due to a material problem with our card, the tests did not always work. We retrieved our system and changed the card, and everthing worked nicely on the second test we did over one week.


_4YUDWziWQ8.png?auto=compress%2Cformat&w=48&h=48&fit=fill&bg=ffffff)


Comments
Please log in or sign up to comment.