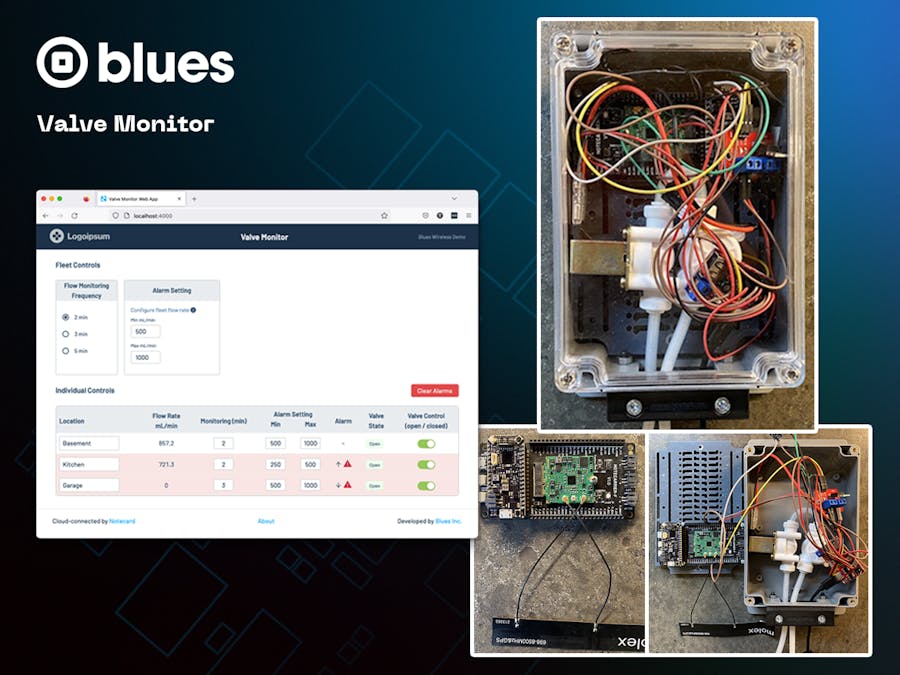
Monitoring liquid and gas transfers is hard.
Most modern systems for handling transfers include many sections of piping, each of which can be isolated or connected to other parts of the system through shut-off valves.
Managing these numerous junction points is a challenge, and frequently requires technicians to manually visit valves to perform shut-offs. To avoid these manual processes, facility managers want the ability to remotely open and close valves, as well as the ability to monitor the flow rate of liquid or gas throughout their systems.
That’s why we at Blues Wireless built a cellular-based project for remotely monitoring the flow rate of a liquid through pipes, as well as a web app that facility managers can use to open and close valves as necessary.
In this article you’ll see how it all works. We’ll start by looking at how to connect the necessary hardware, then look at how the device’s firmware and the project’s web application both work.
Let’s get started.
Assembling the HardwareThe main pieces of hardware you need for this build are:
- A solenoid valve (that can open and close).
- A flow meter (for measuring flow rate).
- And a way of sending and receiving data (so you can control your valve and get readings from the flow meter remotely).
NOTE: If your project only needs to measure flow rate (and does not need a solenoid valve), check out our Flow Rate Monitor project on GitHub.
For the solenoid valve we went with a DIGITEN Solenoid Valve; for the flow meter we went with a GREDIA Water Flow Sensor; and for remotely monitoring and controlling the system we used the various components available in a Blues Starter Kit.
The Blues Starter Kit includes a cellular Notecard, which is a cellular and GPS/GNSS-enabled device-to-cloud data-pump that comes preloaded with 500 MB of data and 10 years of cellular service.
The Notecard itself is a tiny 30x35mm system on module with an M.2 connector, and allows us to send and receive the necessary data over a cellular connection.
To make the Notecard easy to integrate into an existing prototype or project, the Blues Starter Kit also includes a host board called a Notecarrier-F, which includes a connector for the Notecard, as well as a set of headers for any Feather-compatible MCU.
The last part of the Blues Starter Kit is the Blues Wireless Swan, which is the MCU we’ll use to run this project’s firmware. The Swan is an STM32L4-powered board with 2MB of flash and 640KB of RAM. It supports C/C++, Arduino and CircuitPython, and is Feather-compatible so it slots nicely into the Notecarrier-F.
To assemble the hardware of a Blues Starter Kit you can complete the Notecard’s quickstart tutorial, after which you’ll have a setup that looks something like this.
With the Blues Starter Kit you have the ability to send data to (and from) a cloud backend, and we’ll use that ability to control our solenoid valve, and to monitor the readings from our flow meter.
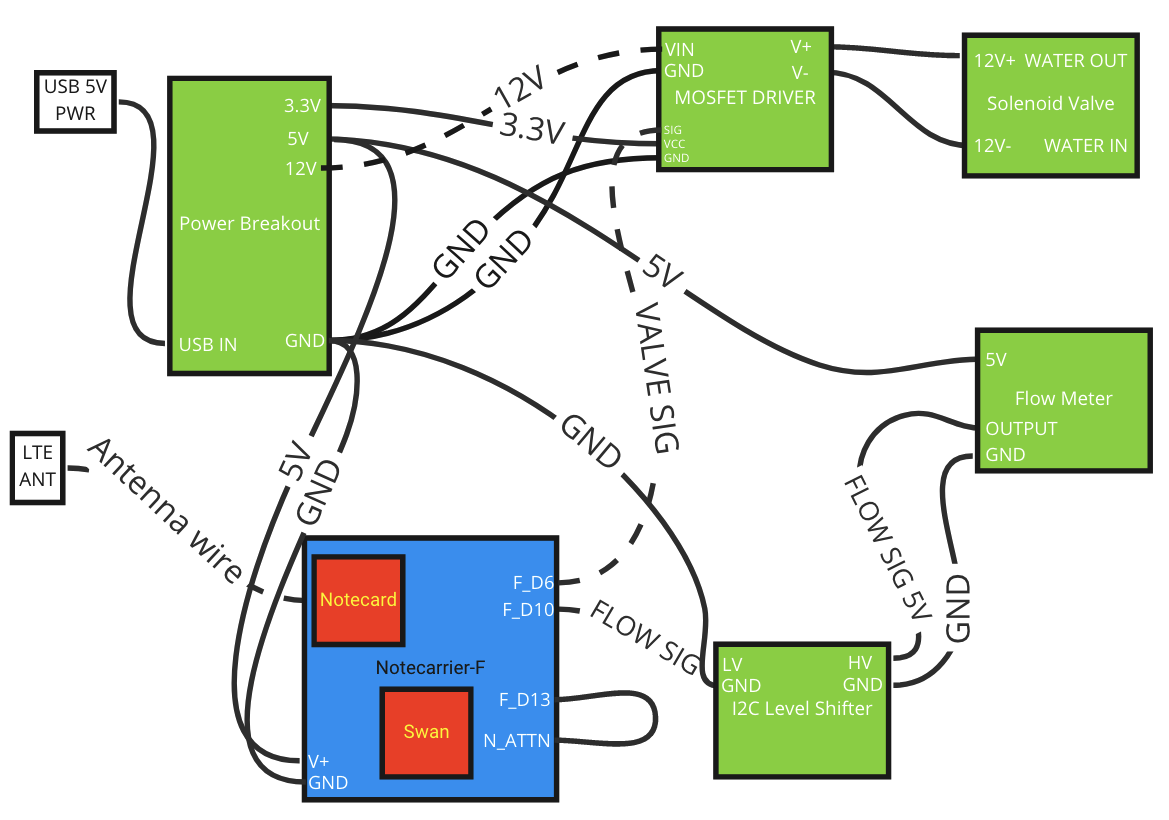
With the Starter Kit ready to go, we next connected both the solenoid valve and the flow meter to the Notecarrier-F using the wiring diagram shown below. You don’t have to set things up exactly as we did, but if you do make sure to check out the full list of equipment we’re using.
Regardless of the hardware you end up using, you must meet the following requirements for this project’s firmware to work appropriately.
- The solenoid valve’s signal line must be connected to the Notecarrier’s
F_D6pin. The firmware uses this pin to open and close the solenoid. - The flow meter’s signal line must be be connected to the Notecarrier’s
F_D10pin. The firmware uses this pin to read the flow rate from the flow meter. - The Notecarrier’s
F_D13pin must be wired to the Notecarrier’sATTNpin. The firmware uses this to respond to interrupts whenever the Notecard receives a command to open or close the solenoid valve.
When everything is put together your build should look something like this.
If you choose to use an enclosure (like this one from Sixfab we’re using in these pictures), your project can fit in a box that’s easy to install in most facilities.
And with that, you now have everything wired to control a solenoid valve and monitor flow rate with the Swan. But to do so, you must first set up a cloud backend for sending and receiving data.
Cloud SetupOne of the great things about the Notecard is it knows how to send data to a cloud backend, Notehub, out of the box. Notehub is a hosted service designed to connect to Notecard devices and synchronize data.
If you’re following along and want to build this project yourself, you’ll need to set up a free account on notehub.io, and create a new project.
After you create the project, make sure you copy your new project’s ProductUID (see screenshot below), as you’ll need that identifier to connect your Notecard to your new Notehub project.
You’ll learn more about Notehub throughout this article, but now that you have the backend set up, let’s next look at the code that makes the valve monitor project work.
Writing the FirmwareThe firmware for this project is responsible for communicating with the Notecard, the solenoid valve, and the flow meter.
The full source code needed to make that happen is available on GitHub, but we’ll show off the most important parts here. We used Platform.io for building the app, using an Arduino application with Swan as the target. (And here are the instructions for getting all of that running on your device, which includes adding the ProductUID you copied from Notehub earlier.)
Managing the Valve
The most important thing the firmware must do is manage the state of the solenoid valve. Our solenoid valve is closed by default, and the firmware must provide power to open the valve when it receives a command from the Notecard.
To do that, the firmware starts by arming the Notecard to receive interrupts using its card.attn request.
// Configure ATTN to watch for changes to data.qi.
req = notecard.newRequest("card.attn");
const char *filesToWatch[] = {"data.qi"};
int numFilesToWatch = sizeof(filesToWatch) / sizeof(const char *);
J *filesArray = JCreateStringArray(filesToWatch, numFilesToWatch);
JAddItemToObject(req, "files", filesArray);
JAddStringToObject(req, "mode", "files");
notecard.sendRequest(req);NOTE: One cool thing about the Notecard is that its APIs are all JSON-based—so to use the Notecard you send simple JSON objects in, and (if necessary) receive JSON objects back as a response.
With the Notecard armed, it will receive an interrupt anytime it receives what we call a Note. A Note is a JSON object containing a developer-provided body, and is the main means of communication between the Notecard and its Notehub backend.
To send a Note you can use the Notehub API’s note.add request, which sends data to your Notehub backend, which in turn immediately forwards that data to your Notecard device.
And because the Notecard is armed to interrupt when it receives certain Notes, the firmware can respond to inbound Notes and open or close the solenoid valve. Specifically, the firmware looks for a Note with the following JSON structure.
"body": {
    "state": "open" // or "close"
}
The firmware has a function for responding to this interrupt, and opening or closing the solenoid valve as necessary.
// Toggle the valve's state. If open, close, If closed, open.
void valveToggle()
{
    if (state.valveOpen) {
        digitalWrite(VALVE_OPEN_PIN, LOW);
    }
    else {
        digitalWrite(VALVE_OPEN_PIN, HIGH);
    }
    state.valveOpen = !state.valveOpen;
}
Reading Data from the Flow Meter
The firmware’s next task is to monitor the flow rate from the flow meter, and to report that value to the cloud backend at a regular interval.
The flow meter pulses its signal line every time 2.25 mL of fluid passes through. So as a first step, we configure an interrupt handler that triggers every time we see a low-to-high transition ("falling") on the signal line.
attachInterrupt(digitalPinToInterrupt(FLOW_RATE_METER_PIN), flowMeterISR,
    FALLING);
In that interrupt handler we increment a counter to track how many pulses have occurred.
void flowMeterISR()
{
    ++state.flowMeterPulseCount;
}
And then finally, we calculate the rate in mL/min by tracking how many pulses have occurred since we last measured (every 500ms by default).
// Calculate the flow rate in mL/min.
uint32_t calculateFlowRate(uint32_t currentMs)
{
    return 60000 * (state.flowMeterPulseCount * 2.25) /
           (currentMs - state.lastFlowRateCalcMs);
}
Once the firmware has the flow rate value, its final task is to send that data to the cloud backend. To do that the firmware uses the Notecard’s note.add request to format and send the flow rate and valve state (open or closed).
J *req = notecard.newRequest("note.add");
if (req != NULL) {
    JAddStringToObject(req, "file", file);
    JAddBoolToObject(req, "sync", true);
    J *body = JCreateObject();
    if (body != NULL) {
        JAddNumberToObject(body, "flow_rate", flowRate);
        if (state.valveOpen) {
            JAddStringToObject(body, "valve_state", "open");
        }
        else {
           JAddStringToObject(body, "valve_state", "closed");
        }
        JAddItemToObject(req, "body", body);
    }
    notecard.sendRequest(req);
}
At this point if you flash the firmware to your device, and start running water through your system, you’ll start to see flow rate readings appearing in your Notehub project’s events tab.
At first all your readings will have a flow rate of zero, as the solenoid valve starts closed and does not allow any liquid through.
But if you send a data.qi note to open the valve using the Notehub API, you’ll start to see the rate in mL/minute.
At this point, you now have firmware that is capable of opening and closing a solenoid valve, as well as taking measurements from a flow meter.
And it all works! But it is a bit of a nuisance to have to go to Notehub to view your data, and to have to use the Notehub API to send commands to open and close the valve. So to make those processes easier we also built a web application for this project.
Using the DashboardThis project’s web application brings everything together by giving facility managers a single place to view and manage all devices in their system.
In addition to being able to open and close valves, as well as view flow rates, we also allow facility managers to configure flow-rate thresholds, and to trigger alarms when their device’s flow rate falls into an unexpected range.
NOTE: In our case we’re showing alarms in a web application, but you could also use Notehub to send SMS messages whenever alarms occur. For details, see our Twilio SMS Guide.
Like everything with this project, the valve monitor web application is open source and available on GitHub, so feel free to use it verbatim, or to customize it to meet your needs.
The web application updates live as you use your system, so it’s a great way to test that your hardware and firmware are working as expected, as you can see flow rates show up in the web app as you’re testing out your hardware.
Final ThoughtsOverall, this project adds automation and intelligence to any facility that performs liquid or gas transfers. Instead of relying on technicians to perform manual actions, you can instead leverage the power of the IoT to automate valve control and flow-rate monitoring.
This project’s firmware and web application are open source, so feel free to check them out on GitHub and tweak them as much as you’d like.
And one more thing—this project is part of a series of accelerators we’re building at Blues, so check out the full list if you’re interested, and reach out on our forum if you have any questions.


Comments
Please log in or sign up to comment.