Welcome back!
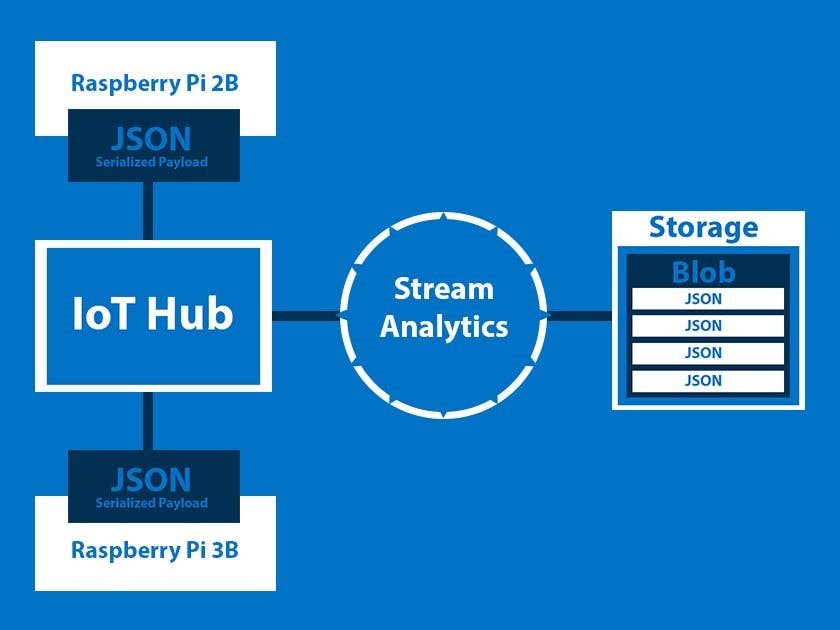
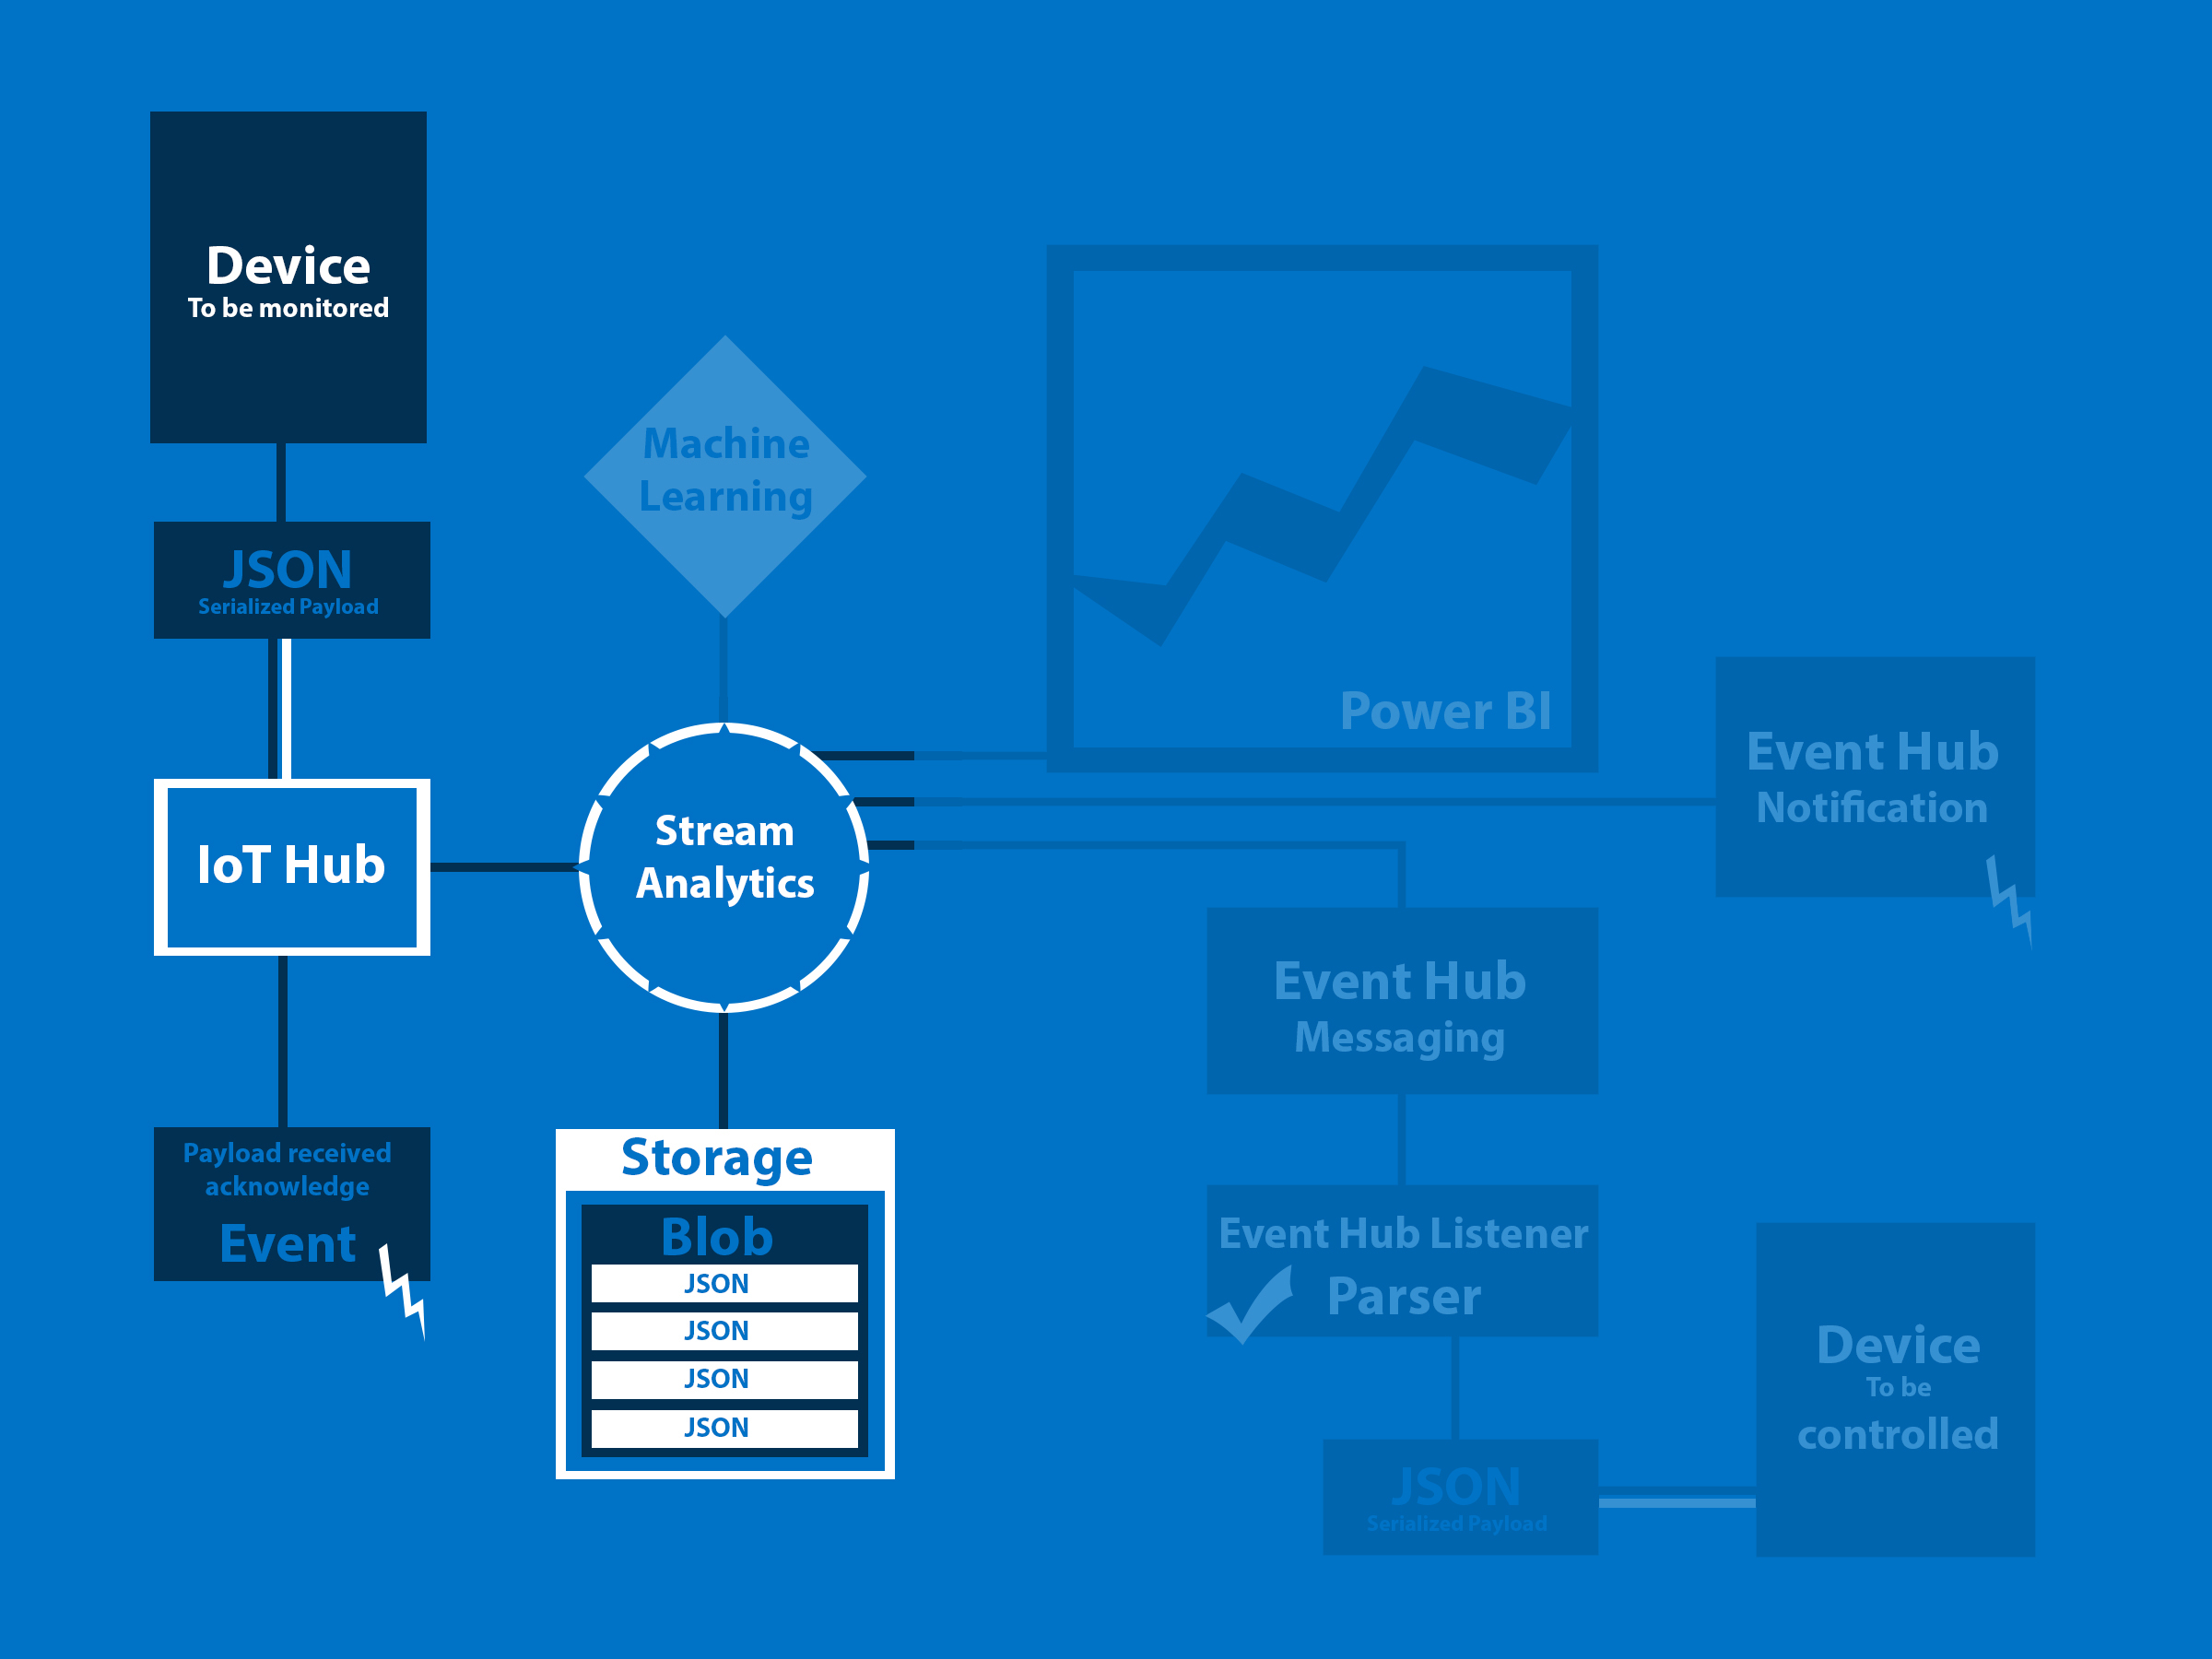
In this tutorial we'll finish setting up the Stream Analytics job that we created in tutorial 001. For this we'll need to create a blob storage and assign it to our stream analytics as a sink/output. We'll also write a Stream Analytics query which will redirect all of our IoT Hub's incoming traffic to the Blob storage for future reference and analysis.
Part 1Let's start by looking at where we left off:
At this point, our stream analytics job doesn't have any input, query or output setup. So our first step is to set our Inputs for the Stream Analytics. Click on the Inputs section on your Stream Analytics blade, then click 'Add'. A new input blade will appear on the right. Provide an alias for the input. Be sure to make note of this name because this name is how we'll refer to the input stream in our stream analytics query. This is very important, so don't forget! After this, choose 'Data stream' as a source type, then choose 'IoT Hub' as the source. Finally, choose a name for the IoT Hub that you want to use for this particular Stream Analytics job. Also, remember to set the Event serialization format to JSON and Encoding to UTF-8. There you go! Now you can click that 'Create' button and see your input setup. (Actually, you might want to wait until you see a message saying, "Successful connection test: Connection to input of '...' succeded")
Now let's set our output. For this you'll first need to create a Blob storage. So let's move our attention to the Storage account for a while, shall we?
To create a new Blob storage, navigate to the 'Storage accounts' link from the left navigation menu. Now click on the name of your preferred storage account. Click on the Blobs under the services. Then, click on 'Add Container', and in the New container blade that opens up at the right give your brand new container an easy to remember name and an access type. In our case, we decided to give it Blob access type, which we believe is less restrictive than private but gets the job done. Finally, click 'Create' and once again wait for the 'successfully created' message.
Ok, now let's get back to setting up output for the Stream Analytics job. For this, once again go back to the Stream Analytics blade by navigating from the left navigation menu. Click on 'Output', then click on 'Add'. This will open a New output blade to which you will assign an Output alias. Once again, this will be the name you'll use to refer to this output in your Stream Analytics Query.
At this point your Stream Analytics Job Topology should look like this:
Now we're all set to start writing a query.
Before we begin writing a query, we'd like to pause for a moment to impress upon you the importance of this step. This Stream Analytics query is actually the heart of this tutorial series, even though this particular query is probably the simplest query of all. By the end of this series, we'll be writing fairly complex queries to control our devices. In a way, these queries combined with machine learning is what will provide intelligence to our devices.
For this tutorial, we're planning to redirect all our incoming traffic to the storage blob, so our query is pretty simple. We're selecting 'all' and sending it into the Output Alias from the Input Alias, as shown below:
In our Azure Portal, it looked something like this:
That's about it! Now we just need to Save and run the Stream Analytics job by clicking 'Save' and then 'Start'.
Part 6One more thing before we run the UWP apps in our Raspberry Pies and start streaming data to the IoT Hub: let us show you another really cool feature of the Device Portal. Open up any one of your Raspberry Pi's device portals, and navigate to the 'Apps' link from the left navigation menu. Then, click on the triangle/play button next to the name of the UWP app that we just deployed onto the Raspberry Pi. (You can also set it up as a Startup app. Isn't that cool?)
Now remote into that Raspberry Pi using your Windows IoT Remote Client, just to make sure the App is running successfully. Do the same thing with the other Raspberry Pi, and make sure the App is running there also. Finally, make sure that the IoT Hub is receiving the payload by logging into the Azure Portal. It should look something like this:
This little diversion was to show you how the Apps in the Raspberry Pi can be run without having to use precious Visual Studio instances.
Part 7That's about it. Now we're finally ready to start the Stream Analytics job. We can do that by clicking the 'Start' button at the top of the Stream Analytics job blade.
After successfully starting the job, you might want to wait for a little while so that your storage will be populated (remember, we set a 30 second interval into our code). Then you probably want to browse into your Blob storage to check if your IoT Hub stream data is being redirected into the Blob storage. Browse through your Blob storage and locate the .JSON file that has been created for your data storage (It will be in the path you set up while setting up output). Also take note of the size of the file.
Now download that file into your computer and browse into it. It should have all the data that you've sent to the IoT Hub as payload in a nicely formatted, line separated, JSON format.
Hooray! We did it. So now we have our sensor data stored in the cloud. This can be accessed from anywhere for further analysis or visualization using Power BI. In the next tutorial, we'll show you how to create an Event Hub and use it to filter our IoT Hub stream data using Stream Analytics. We'll also redirect it into the Event Hub as sink.
Bye for now!


Comments
Please log in or sign up to comment.