Have you ever wanted to take a peek inside your code to see why it's behaving the way it is? Traditionally in ESP32 projects, you would have had to add endless print statement to try figure out what was going on, but there is a better way!
A debugger is a way of seeing what is happening at particular sections of your code and to try out different variable values without re-compiling your code, usually this is not something available to us on embedded projects, but in this guide I will show you how to use it on an ESP32.
In this guide I'll show you to setup the hardware, setup the software and show a simple example of using the debugger.
Supplies:ESP-Prog - This is the board needed for debugging
An ESP32 that breaks out pin 12, 13, 14, 15
[OPTIONAL] Debug Shield I sell on Tindie
* = Affiliate Link
Step 1: Check Out the Video!I have a video on this topic if you want to check it out.
On my channel I usually make ESP8266 and ESP32 based videos, so if you are interested in those, please check it out!
Step 2: Hardware - Parts & WiringTo use the debugger you only need an ESP-Prog and almost any ESP32 board (links to these in an earlier step)
ESP-Prog:
The ESP-Prog is a board designed by espressif, the makers of the ESP32 and ESP8266 chips. It connects to JTAG pins of the ESP32 to allow us to use the debugger.It can also be used for programming ESP32 boards, but I won't be covering that here.
ESP32 Board:
You can use basically any ESP32 board for this once it breaks out the JTAG pins, which are 12, 13, 14 & 15. I've tested both an Adafruit feather Huzzah32 and a D1 Mini 32 board and they both worked fine.
Please note that you can use the JTAG pins in your sketch with the debugger, for example the built-in LED of the Huzzah32 board is on pin 13, so you can not use it while debugging.
Wiring:
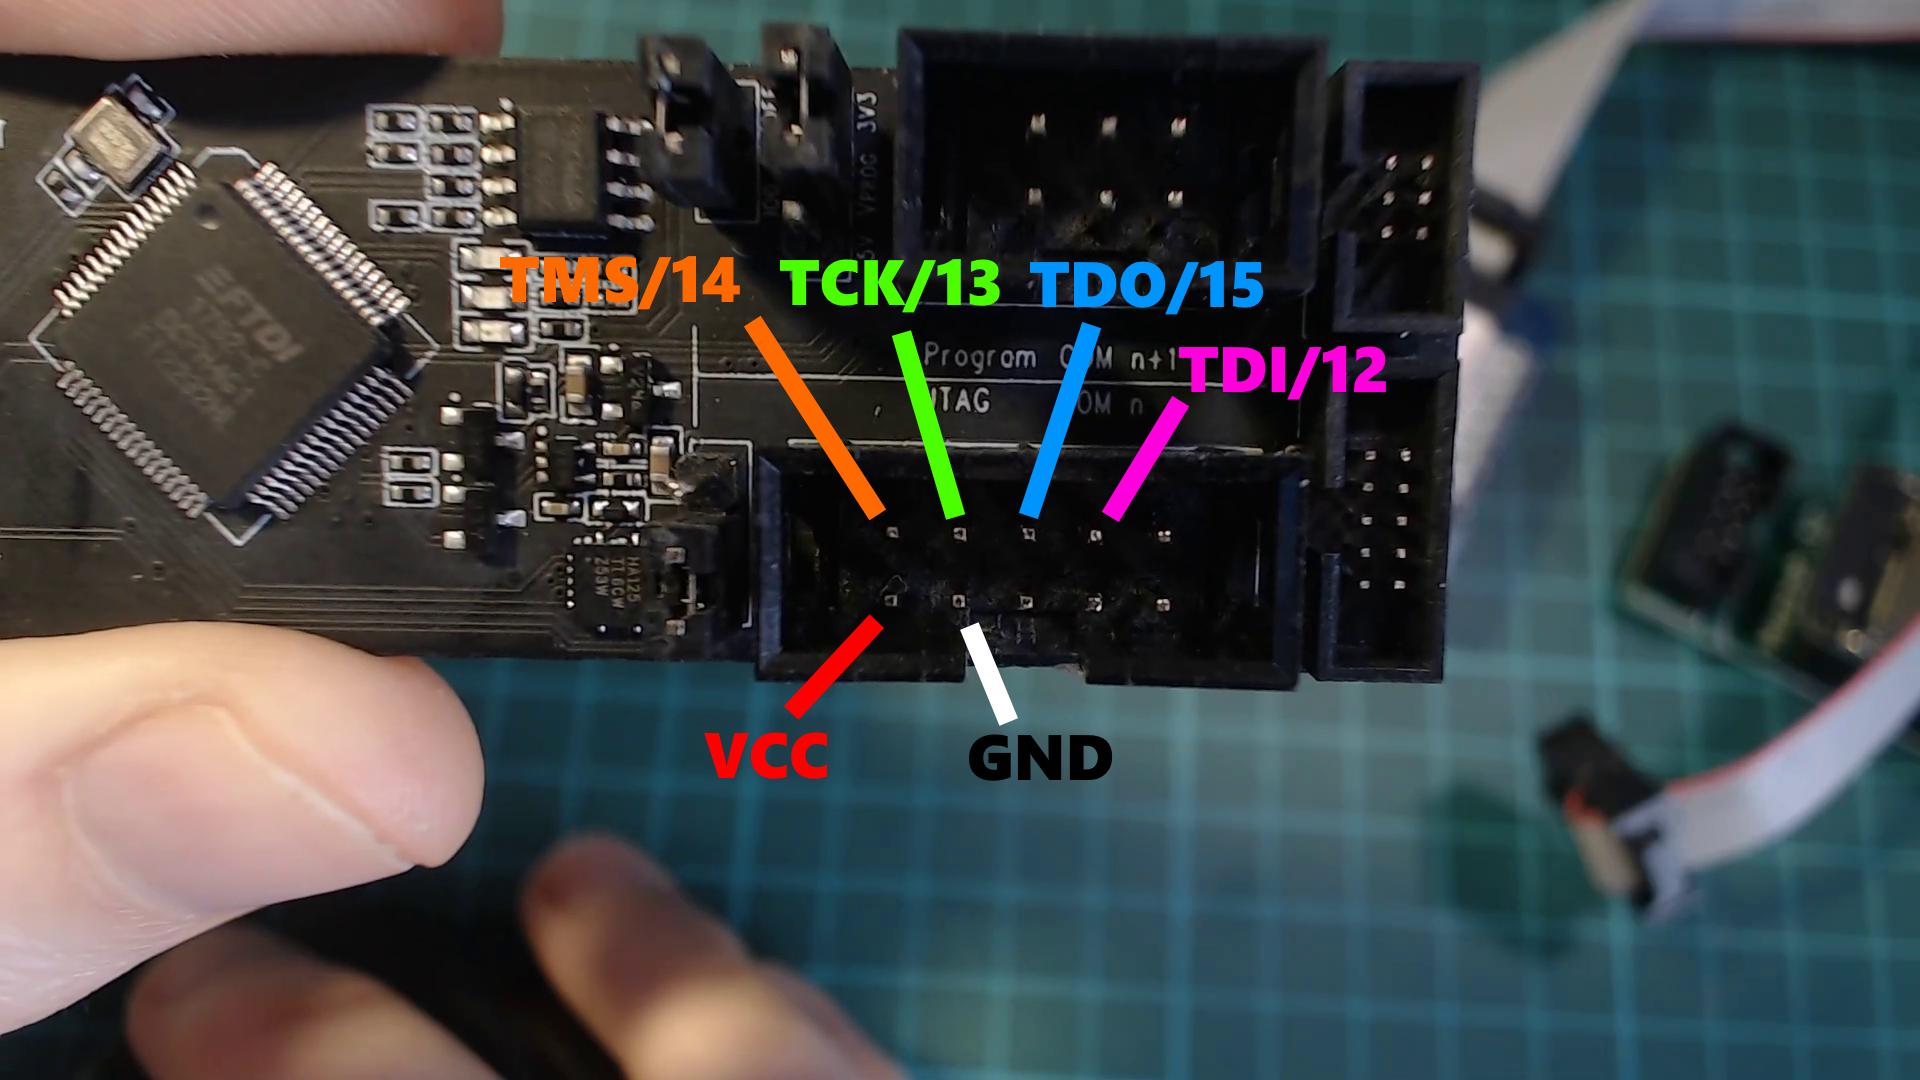
To connect the ESP-Prog to the ESP32, just use the wiring guide as provided in the picture above. Check with the wiring diagramof your ESP32 board if you don't immediately see the appropriate pins as sometimes they use a different naming scheme.
Debug Shields:
These are optional, but I sell some shields on Tindie for the Huzzah32 and the D1 Mini 32 that make connecting the ESP-Prog really simple, it breaks out the appropriate pins to an IDC connector that you can use a ribbon cable to connect directly between the shield and the ESP-Prog
Step 3: Hardware - Driver SetupIn order to use the ESP-prog for debugging, we need to install the appropriate drivers for it. PlatformIO provides some steps for that here, but I will go through the Windows steps in this guide.
- Download and install the FTDI drivers for the ESP-Prog from here, scroll to the right to download the "setup executable" version to make it easier.
- Download and install the tool Zadig from here, this allows us to install a generic driver needed for debugging.
- With the ESP-Prog plugged in, open Zadig
- In the Zadig application, under "Options", click "List All Devices"
- The drop down in Zadig will now be populated, select the "Dual RS232-HS (Interface 0)" option. Make sure it's interface 0 you select!
- To the right of the green arrow, "WinUSB" should be selected, then click "Replace Driver"
When that is finished your drivers should be setup for use!
Note: If you change the USB port you are using for the ESP-Prog, you may have to repeat steps 3-6 again. If you get an error as shown in the picture above when debugging, you need to repeat the steps.
Step 4: Software: Installing PlatformIOPlatformIO is a IDE for developing with various different embedded frameworks, including the Arduino eco-system. It is more complicated to use than something like the Arduino IDE, but it is very powerful and has some features that the Arduino IDE sorely misses, such as auto-complete.
It is required to PlatformIO to use the debugger. If you are already familiar with PlatformIO, feel free to skip ahead a couple of steps.
- Download and install Visual Studio Code (VS Code) from the link provided on the PlatformIO.org website
- Open VS Code, and open the extensions menu, the button is highlighted in the picture above
- Type "platformio" into the search, select it and click install.
Using PlatformIO is a little bit different than using the Arudino IDE, so in this step we'll just cover the basics of getting an example running on a board.
Opening An Example:
- Click the Home button on the PlatformIO toolbar (As shown in the picture)
- Click "Project Examples" button
- Select the "Arduino-blink" example under the Espressif 32 section
This will open a sample blink project. The layout of a PlatformIO is pretty different compared to an Arduino project, so let's go through the basics.
Where is the code?
The code for your project will be stored in the "src" folder, for the blink example you will see a "blink.cpp" file, this file is the same as your sketch file (.ino) in an Arduino project.
How to I configure my board?
Configurations for your project are kept inside a "platformio.ini" file in your project. This is actually one of my favorite things about PlatformIO compared to the Arduino IDE, it never made sense to me that board settings were not tied to sketches.
The example.ini contains definitions for multiple different boards, but to keep things simple let's delete the bottom two definitions.
Where do I set my COM port?
PlatformIO will actually automatically try to find the correct COM port to use, so you can actually get away with not setting anything for this. But if you have multiple COM ports, which you will when using the debugger, I think it makes sense to set the specific one you need.You can see the different devices you have by clicking the "Devices" section in the home tab, and you can set which one your ESP32 is in the "platformio.ini" by adding a "upload_port" configuration.
How do I upload my code?
Click on the Upload button (icon is an arrow pointing right) and it should compile and upload the code. You should now have a blinking LED on your board.
Step 6: Debugging: Potential Banana Skin!This is something that caught me out when I was preparing this and will hopefully be fixed by the time you try it, but I thought it was important to leave here.
At the time of making this guide, the latest version of PlatformIO is 4.3.0 and it has a bug that relates to being able to debug. Thankfully we can update to the latest development version pretty easily which solves the problem.
Check on the Home page the version of PlatformIO core, if it is "4.3.0", perform the following steps.
- On the PlatformIO toolbar, click the terminal icon
- In the terminal type: pio upgrade --dev
- RestartVS code and PlatfromIO should be updated
We need edit the "PlatofrmIO.ini" file to enable debugging, we only need to add two things to it.
debug_tool = esp-prog
This sets the debug tool we are using.
debug_init_break = tbreak setup
This is a trick we learned from Andress Spiess' video on debugging on the ESP32. It tells the debugger to stop in the setup of our application.
Step 8: Debugging: Starting DebuggingBefore we get into it, we will make a minor change to the sketch that will make it easier to demonstrate what you can do with the debugging.
- Create a new variable, "int delayTime = 1000;" outside of any methods, this will make it a global variable.
- Replace the number inside the delay calls in the loop with this new variable: delay(delayTime);
Upload the code to the board once more, then to start debugging, in the toolbar, click "Run" then "Start Debugging"
You will see the things moving in the terminal window, but even when that states that it was success, if you click on the "Debug Console" you will see it is still working way, it will take a few seconds to finish.
If everything went as expected you will see the debugger stop at the start of the setup.
Step 9: Debugging: Basic UsageLet's cover some of the basics of what you can do with the debugger
Creating Breakpoints:
A breakpoint is a point of your code where you want the debugger to stop. To create a breakpoint click to the left of the line number. As demo, add breakpoint to the first line in the loop method.
Breakpoint Navigation:
To move between breakpoint or move to the next line of code, you can use the tools that will appear on the top of the screen. Press the "continue" button (looks like a play button) to move the breakpoint we just created inside the loop.
Variable Watches:
Variable watches let you monitor the value of variables when the debugger is stopped at a breakpoint. To add a new variable watch you can click on the + icon, then just type in the name of the variable. As a demo, type in the variable we added in the previous step "delayTime"
Variable Viewer:
You can also see all the variables and their values that are available at your current breakpoint. To demo this, If you look in the "Global" section you should find the "delayTime" variable.
Editing the Value of Variables:
You can also edit the values of variables and it will take immediate effect on your codes behaviour. To demonstrate this, click on the delayTime variable in the Variable Viewer section, and change the value to "100". To show this working, disable the breakpoint inside the loop by clicking to the left of the line number again. Press the continue button on the breakpoint navigation bar. The LED on your ESP32 should now be blinking much faster than before.
Step 10: TroubleshootingI found during my testing, that some times I couldn't upload to the ESP32 while it was connected to the ESP-prog, and I couldn't figure out a pattern to why this happened, because most of the time I could upload without any problems. I found I could just disconnect the ESP32 and the ESP-Prog, upload the code to the ESP32 and then reconnect them and it would work fine.
Step 11: ConclussionI think this is a really cool tool to add to toolbox to help figure out what is going on inside your project.
I'd love to hear if you find this useful!. Please let me know in the comments below, or join me and a bunch of other makers on my Discord server, where we can discuss this topic or any other maker related one you have, people are really helpful there so it’s a great place to hang out.
I would also like to give a huge thanks to my Github Sponsors who help support what I do, I really do appreciate it. If you don’t know, Github are matching sponsorships for the first year, so if you make a sponsorship they will match it 100% for the next few months. Thanks for reading!


Comments
Please log in or sign up to comment.