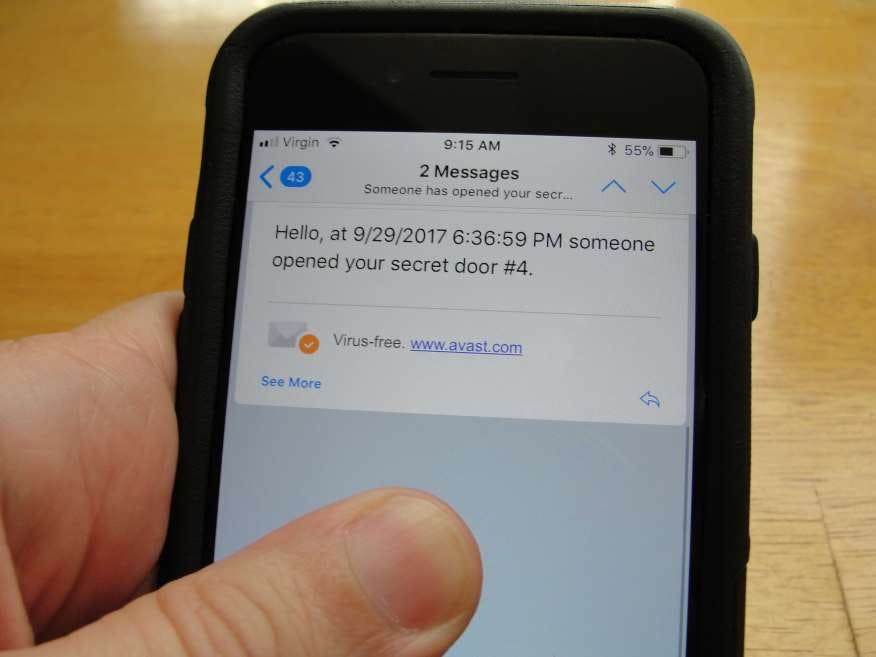
Are you having friends over to take care of your pets while you are out of town, renting out your home, or have neighbors checking on thing?
With pressure monitoring you can see the history of events in your home, such as when doors open, or have email alerts if renters are raiding the supply closet or liquor cabinet.
This kind of monitoring can be inexpensive, and not as prying as security cameras with microphones.
And we know how important security is these days.
Your home could be smarter, by not spying on your guests.
Safer by reporting activity.
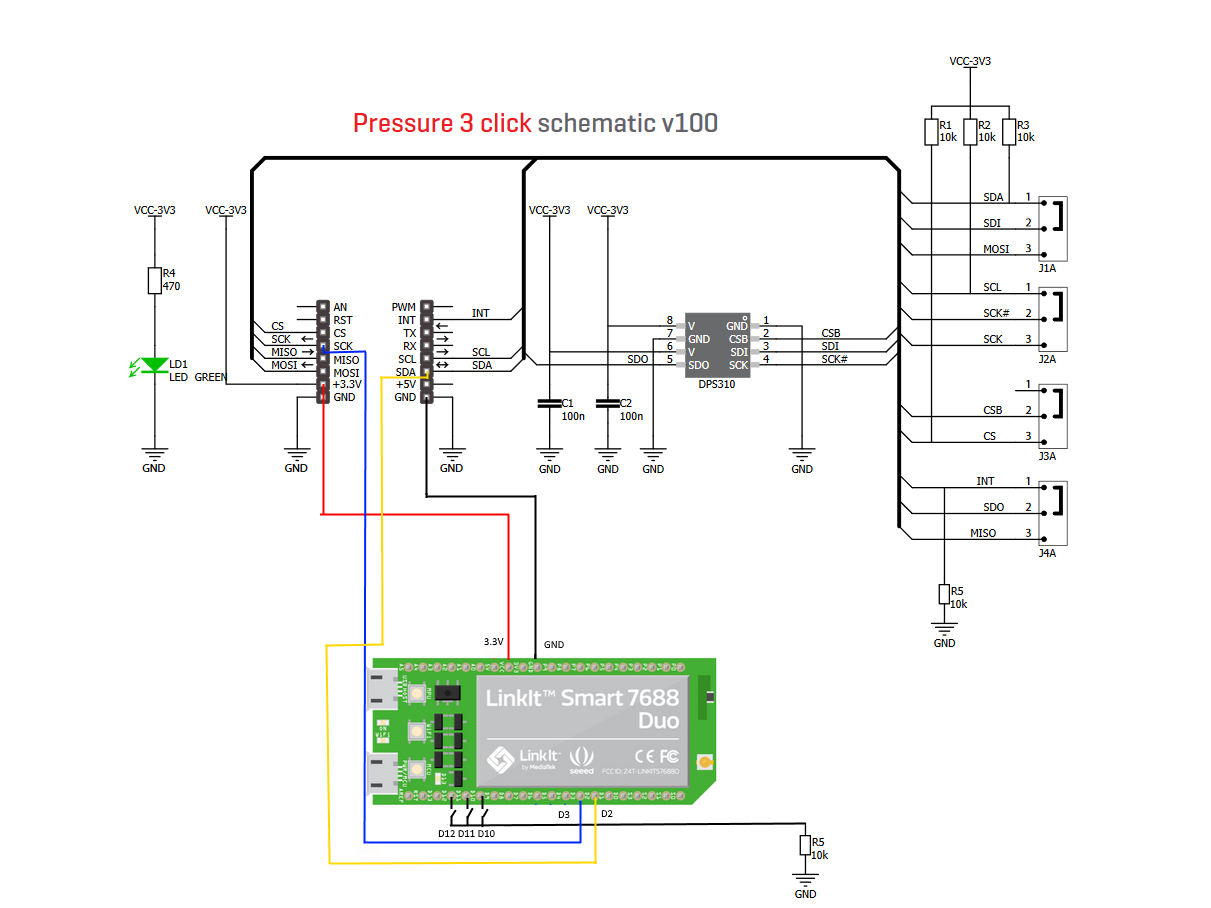
This project uses a DPS 310 pressure sensor to monitor pressure and temperature in rooms in a house.
The DPS310 is connected to a LinkIt Smart 7688 Duo to process the sensor data and send it to a server API.
The server saves the collected data to a SQL Server database, and also processes alerts, such as when a door is opened, by sending an email immediately.
There is also an ASP .NET MVC application that is used to plot the data.
DataSince we would like to have real time alerts, and also keep a history of data at the same time, we need an efficient way to parse the data without flooding the server with real time data.
In this case we can program the Arduino to measure the incoming data over a period of time of about 5 minutes, and then transmit the high and low values to the API to be saved in the SQL Server database.
At the same time, the Arduino can monitor an average value, and when the pressure deviates by a set interval it will send a request to the API to send an email alert.
It does this by calculating a moving average and then sending an email if the pressure is out of range:
IoTThe IoT device used in this project is the Seeed Studio LinkIt Smart 7688 Duo. This is a powerful device that is compatible with the ifx_dps310 library.
Setting up the LinkIt Duo has several steps that are well documented on the mediatek website:
Sign in to the linkit duo web UI
Enable the Arduino Yun Bridge library
Now you will need to install the DPS310 Arduino Library
Next, upload the sketch MeasureAndSendDPS310-HighLow
Uploading a Sketch with the Bridge
Uploading a sketch with the Bridge is a little tricky at first, since the Bridge uses the serial port.
To upload your sketch, click on Tools->Port and choose mylinkit at 182.168.x.x (LinkIt Smart 7688 Duo)
Click the Upload button. You will have to enter your password to upload to your LinkIt.
After it uploads, it may prompt you for your password again. Click Cancel.
At this point your Arduino is waiting patiently for the COM port to open.
Now, go to Tools->Port again and choose COM4 (or whatever COM port you are connected to).
Now as soon as you open the Serial Monitor your code will start running. This is because of the line of code in your sketch that says
While (!SerialUSB);
You should see streaming sensor data like this:
The API receives data from the LinkIt Duo connected to the DPS310 and adds it to a SQL Server table named Measurement. The table script is included.
You can test the API locally with PostMan, as shown below:
So you can test the API locally with Postman, but this is where it gets tricky. IIS Express can only use localhost, and you cannot connect to localhost outside of the machine.
So now the problem is that we cannot access the localhost machine because of the way that IISExpress is configured with .NET Core 2.0.
Here are more details: https://weblog.west-wind.com/posts/2016/Sep/28/External-Network-Access-to-Kestrel-and-IIS-Express-in-ASPNET-Core
We can modify our Program.cs file (not the Startup.cs file) to choose a port to run on and open the firewall for it, like port 5000.
namespace DPSAPI
{
   public class Program
   {
       public static void Main(string[] args)
       {
           // use this to allow command line parameters in the config
           var configuration = new ConfigurationBuilder()
               .AddCommandLine(args)
               .Build();
           var hostUrl = configuration["hosturl"];
           if (string.IsNullOrEmpty(hostUrl))
               hostUrl = "http://0.0.0.0:5000";
           var host = new WebHostBuilder()
               .UseKestrel()
               .UseUrls(hostUrl) // <!-- this
               .UseContentRoot(Directory.GetCurrentDirectory())
               .UseIISIntegration()
               .UseStartup<Startup>()
               .UseConfiguration(configuration)
               .Build();
           host.Run();
       }
   }
}
Now you can go to the project folder in a command prompt and type “dotnet run”. The port will default to 5000, and your API should be exposed through the network.
Email Alerts
Now you can set an Email alert for an opened door which will have absolutely no visible means of security – like no magnetic switches, no wires, etc. And no real way to tell that an alarm was tripped.
This is achieved with code in the LinkIt Duo. When a change in pressure is detected a request is made to the EmailController at an address like http://localhost:5000/api/email/7.
JQPlot Charts
Charting is accomplished with JQPlot.
In the view, a .jpg image of a floorplan is used along with some SVG polygons to map out clickable areas:
<h2>Activity</h2>
<div style="width: 100%; overflow: hidden;">
   <div id="chartdiv" style="height: 400px; width: 500px; float: left;"></div>
   <div id="floorplan" style="height: 543px; width: 376px; margin-left: 520px;">
       <svg xmlns="http://www.w3.org/2000/svg" xmlns:xlink="http://www.w3.org/1999/xlink" width="543" height="376">
           <image x="0" y="0" width="543" height="376" xlink:href="~/Images/floorplan50.jpg"/>
           <a xlink:href="@Url.Action("LineChartRenderer", "Home", new {deviceId = 1})">
               <path d="M139,125 L226,125 L226,217 L139,217 Z" class="visible-on-hover"/>
           </a>
When a room in the floorplan is clicked, the LineChartRenderer is called in the HomeController. After this, an Ajax call is made to the GetLineChartRenderer which returns a JSON result.
To pass the deviceId we use TempData, then use the deviceId to query the database.
We pull two series of data, the high and low pressure readings for an hour, then pass the results to JQPlot in the LineChartRenderer view.
       public ActionResult LineChartRenderer(int? deviceId)
       {
           TempData["deviceId"] = deviceId;
           return View();
       }
       public JsonResult GetLineChartRenderer()
       {
           int? deviceId = (TempData["deviceId"] as int?);
           var DbResult = from d
                          in context.Measurements
                          where d.DeviceId == deviceId
                          orderby d.Time descending
                          select new
                          {
                              d.PressureHigh,
                              d.Time
                          };
           var DbResult2 = from d
               in context.Measurements
               where d.DeviceId == deviceId
               orderby d.Time descending
               select new
               {
                   d.PressureLow,
                   d.Time
               };
           List<IQueryable> resultsList = new List<IQueryable>();
           resultsList.Add(DbResult.Take(40));
           resultsList.Add(DbResult2.Take(40));
           return Json(resultsList, JsonRequestBehavior.AllowGet);
       }
The following shows the resulting activity when two rooms are clicked successively:


Comments
Please log in or sign up to comment.