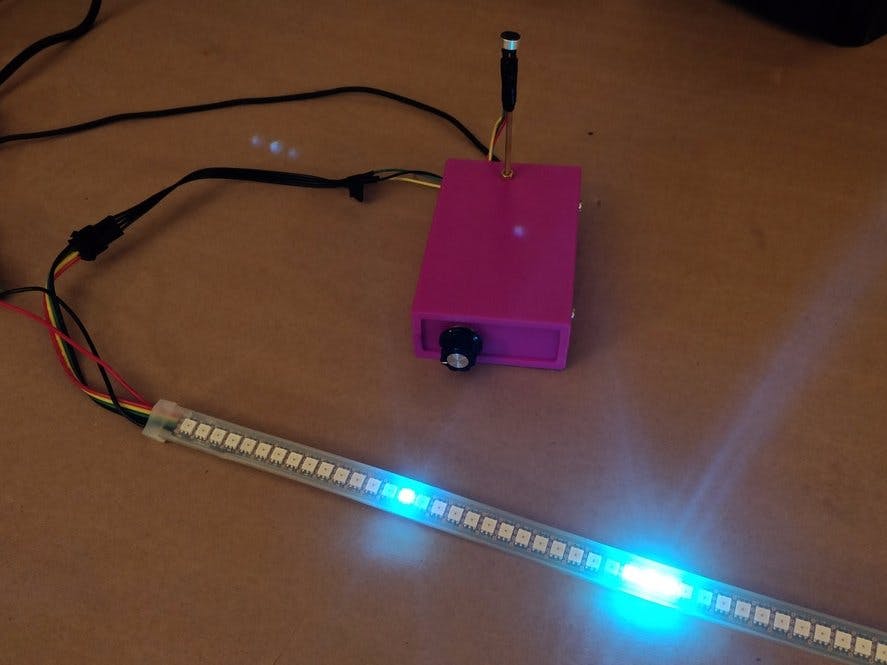
A long time interest since college math has been applications of the Fourier Transform, especially analysing audio. So when the Sony Spresense was announced I was intrigued by the audio subsystem and writing software for it, in both the Arduino and nuttx SDK, to create a version using a microphone input and a strip of addressable LEDs for the frequency. I had previously made one with a strip of neopixels that could display audio from a wav file. After receiving a kit, a few tests bore out the feasibility of make a high quality display.
The Spresense can provide audio at rates of 192,000 samples per seconds (192ksps), 48k or 16ksps. Since we are only interested in the lower fundamental frequencies 16ksps was chosen as adequate to cover up to 8kHz, way above our frequency range of interest, which is the piano keyboard, which has these frequencies for notes of the scale, from C0 16.35Hz to B8 7902.13Hz.
Actually it turns out a Discrete Fourier Transform, while very popular, is a poor match for musical analysis. For one thing, it outputs a ranges of frequencies in a linear scale. So for 16Ksps and an N=256 size transform, we get frequencies bins of 16k/256 = 62.5Hz, from 0 (dc), 62.5, 125, 187.5,.. up to 7937.5 and 8000Khz, the Nyquist limit (half the sampling rate). However notes of the musical scale, in the 12 tone equal temperament scale, are logarithmic by frequency, and related by the twelfth root of 2.
In python:
>>> 2.**(1./12.)
1.0594630943592953
Taking a standard frequency of A, A3 is 220Hz. You can calculate the frequency of each note in the scale by multiplying (above) or dividing (below) by twelfth root of 2 to the power of the number of steps. Thus the note just above A3 is 220*1.05946 = 233.0812Hz, and a third above is 220*1.05946^3 = 261.63Hz for C3. 12 steps above, a whole octave is 2 (the twelfth root of 2 to the twelfth power) times the frequency, so the range of the frequency interval doubles for every octave. A3=220Hz, A4=440, A5=880, A6=1760, etc. Not a good match for the linear scale of the fourier analysis! While I do have an algorithm and code to map a frequency bin to the nearest note, that is still in progress and others have done much work with other techniques like wavelets, constant-Q transform, etc. So this linear/log relationship means that the same chord or arpeggio in a lower octave will be bunched up close, while those higher in frequency spread out.
Another issue with the DFT is the poor frequency resolution at low notes. Going for higher frequency resolution by increasing the FFT size has a trade off with longer time intervals - for 16Ksps, 512 samples take 32mSec and 1024 take 64mSec, which starts to get flickery with noticible delays.
This project has 3 sizes of FFT working, N=256, 512 and 1024. At 16Ksps, 256 samples are 16milliSeconds of time. The KissFFT library used in this project can process the 256 real samples in under 15mSec, leaving enough time to update the LEDs and display the analysis at a blazing fast 62.5 times per second. The DFT returns 128 usable samples, which easily fits in our 144 LED strip and can keep up with the fastest changing sounds. The KissFFT library was chosen as a generic c-code DFT that Just Works as a drop in library as it is, with no changes or tweaking needed. Converting it to a real Arduino library would be a good project as there appears to be demand for non-hardware specific DFT code.
For this project we use the Arduino development environment. The nuttx sdk has some great audio examples and should be workable to do the same processe, plus can use multiple processors (asmp) and there is an fft example that looks much faster using the Sony Spresense dsp system. That will be another project later!
Construction
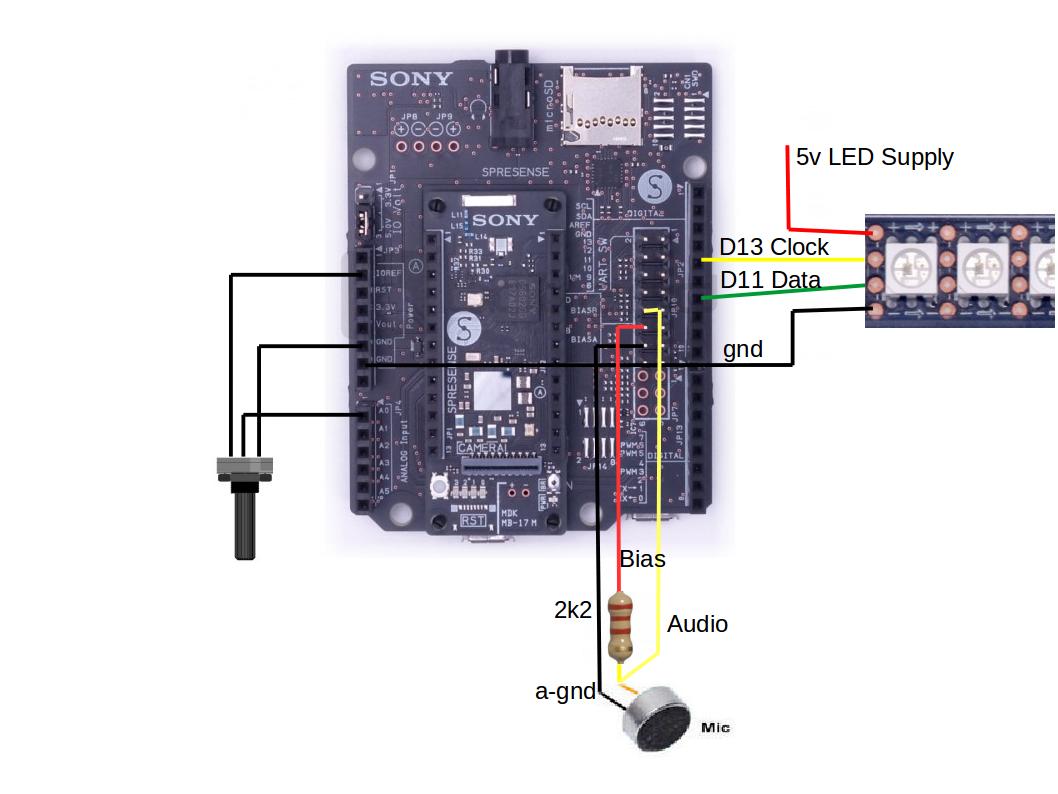
Connect the electret microphone with a 2k2 bias resistor as shown in the diagram, the SPI buss connections to the DotStar LED strip and an analog pot input is always handy. The analog pot sets the minimum sound level that gets displayed. Doing a DFT has some 'grass' noise floor even in quite surrounding or even the mic disconnected, so we can turn up the threshold so that the LEDs are dark until a certain audio level is reached.
After installing the Arduino IDE and setup for the Sony Spresense board per the instructions, load one of the sketches from the github links, fftleds_N256.ino is recommended to start as it is the easiest. Program the board then connect to the serial port with a terminal to get a reading on the processing time, screenshot below. I use Ubuntu so this works if picocom is installed and the device shows up at ttyUSB0 (see 4.1.2 Linux in the Arduino IDE instructions to find the device node)
$ picocom -b 115200 /dev/ttyUSB0
The Arduino sketches are based on the Audio Example "pcm_capture.ino" which delivers a steady stream of 512 bytes to a function called signal_process(). These 512 bytes have 256 samples of 16bit signed word PCM audio. We use a union to convert the words in the char array s_buffer[] to a double in the Kiss DFT 'in' array while multiplying by the window function.
The DFT sketches have a Hamming window pre-calculated and applied to each DFT input array. Here are plots of the 3 different sizes included in the sketches, in the hammingwin.h tab.
A call to the kiss_fftr() returns the processed 'out' array which we use to light leds in the DotStar strip. We use the kiss_fftr() function which takes 'real' samples, not complex, and is hence nearly twice as fast. Two lines around the call to signal_process() note the time and the difference is printed in microseconds.
signal_process time: 15594
signal_process time: 15533
signal_process time: 15552
signal_process time: 15655
Just in time for a 16mSec chunk of data!
For the LED display, each LED displays one DFT bin, which is a complex number with a real and an imaginary part. I Learned in this project that the complex number reflects not only the amplitude of the frequencies around that bin, but also the phase. We compare the magnitude ( sqrt(r^2 + i^2) ) to the threshold pot setting and if that is greater we light the led, otherwise write zero for the RGB values. Since we have three LEDS and 2 distinct pieces of information about the signal at that frequency, we can display the real component in the GREEN led and the imaginary part in the BLUE, so less information is lost. That allows some interesting effects like playing a signal generator app on a phone while moving it back and forth from the mic and watch it displays a pulsing phase change from the movement.
Here is a video of the first test, linear audio sweep
Slower sweep tones test
Here is a different test using GNURadio gnuradio-companion to generate wideband noise and filter it to pass the frequencies of 880 to 1760Hz
Filtered white noise at a higher band.
Here is wide band white noise test
Musical scales are narrow at lower frequencies and wider at higher frequencies
Here is Spresense listening to some (royalty free) electronic music using the N=512 fft size.


Comments
Please log in or sign up to comment.