Using two particle argons we were able to display the changing temperature of wine to determine when the wine would be optimal for consumption. One argon acted as the Display receiving the signal from the sensor and turning it into a digital reading. The other argon flashed the sensor and received continuous updated data on the temperature of the wine.
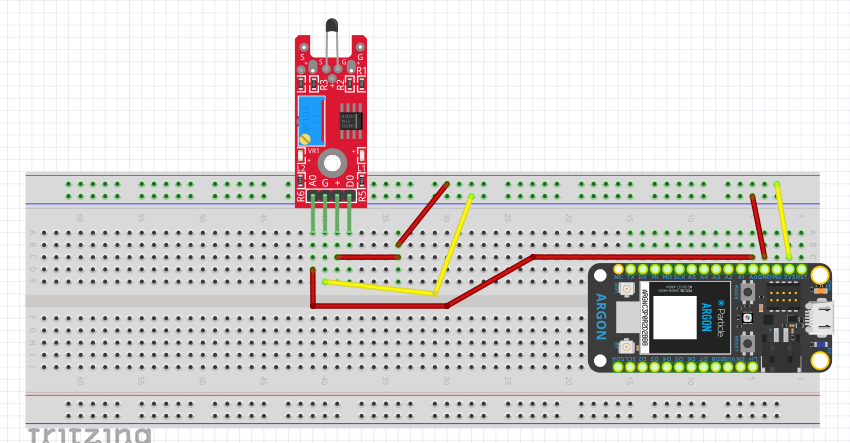
Temperature Sensor
This temperature sensor reads the temperature through electrical signals and then sends the data wirelessly to the display circuit. The Temperature sensor includes a temperature sensor, found in the 37 in 1 sensor kit, a particle argon as well as some jumper wires. The temperature sensor uses a thermistor to measure the temperature. The thermistor on the temperature relies on resistivity to calculate the accurate temperature. The sensor then charts the data in google docs using ….
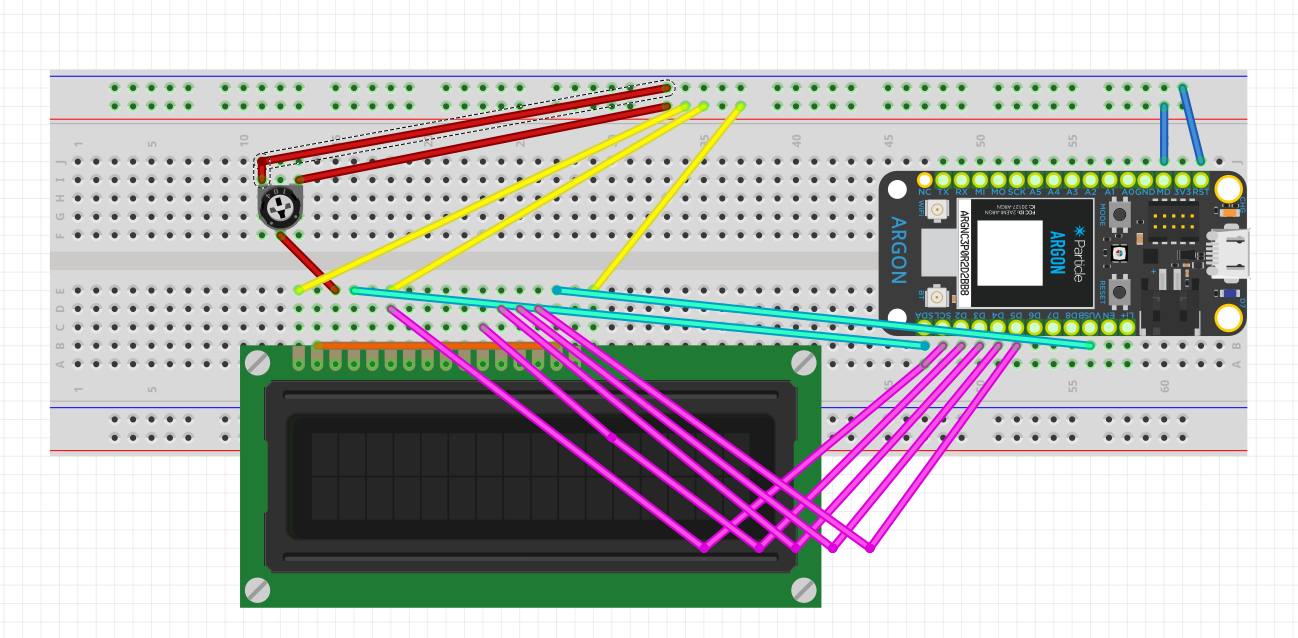
Display
The particle argon is subscribed to a value obtained through the temperature sensor. This is then displayed on the LCD Screen and updated every 1 ½ seconds. The display then sends a signal back to the temperature sensor to turn on a LED.
Display Print with Sensor Reading
Charting Data
We made a command that automatically records the temperature sensors data to a Google sheet. Which is then charted in order to see what the sensor is recording. In order to exhibit the chart working we took the temperature sensor from a room temperature room and placed it into a freezer to illustrate its change in temperature. Below is the link to the google sheet as well a screenshot of the chart:
https://docs.google.com/spreadsheets/d/17_xhpLoq45z70TCJY8blxM2j8bruDYEzfwJRP8Xq46o/edit?usp=sharing
Attached is a video detailing our wine sensor process.


_zhWsCcSEcl.jpg?auto=compress%2Cformat&w=48&h=48&fit=fill&bg=ffffff)


Comments