


Hardware components | ||||||
_zhWsCcSEcl.jpg?auto=compress%2Cformat&w=48&h=48&fit=fill&bg=ffffff) |
| × | 3 | |||
 |
| × | 2 | |||
 |
| × | 1 | |||
 |
| × | 3 | |||
 |
| × | 1 | |||
 |
| × | 1 | |||
 |
| × | 1 | |||
 |
| × | 1 | |||
 |
| × | 2 | |||
 |
| × | 1 | |||
Software apps and online services | ||||||
 |
| |||||
 |
| |||||
Has your AC unit ever leaked water? Has your home ever been without AC on a hot day, causing uncomfortable amounts of heat?
Unfortunately, this can be a very common scenario for an individual. The dreaded feeling of an AC unit going bad means no controlled air flow or temperature and, frankly, a lot of money for repairment. However, catching something like this early can be a game-changer. Turning off your AC unit as soon as a problem is detected can prevent the unit from completely breaking down with rising water levels.
Our IoT project aims to solve the problem of an AC unit going bad by monitoring the water level and temperature within the unit.
So, why does an AC (air-conditioning) unit collect water in the first place?
According to Cielo, the AC unit contains components called evaporator coils. Warm air from inside a home is blown over these coils and causes the air to condensate, controlling the humidity in the house. The catch is, when your AC begins to leak water, there becomes a problem which can quickly be serious. Your AC may still work, but the functionality of it will sharply decline until it is no longer viable.
So, with the help of three Particle Argon devices and a three sensors, we created a monitoring system which can display a low, medium, or high water level as well as the temperature of the water or environment (wherever the temperature probe is placed). Upon securing the water level and temperature sensors in the desired position, the LCD display will indicate read-outs for both the water level and temperature. Additionally, two LEDs are wired to the sensors to serve as a second-source indicator. A green light means the water level is low. A red light, however, means the water level is on the rise (indicating either a medium or high water level). The LEDs, in particular, are easier to see and therefore, can be utilized as the first checkpoint for a saturated, prematurely failing AC unit. Once the LED lights red, it's time to check the LCD display, which can indicate the level at which the water is. The temperature also serves as a strong indicator of failure as it will rise without the help of the AC unit which should be cooling continuously. The indicators can signal to immediately turn off the AC and get repair before it is too late.
This is a project which can assist many people, especially those without technical knowledge of air conditioning and central heating systems. The details of how the device works are explained in further detail in the video down below.
Individual circuit builds can be seen below.
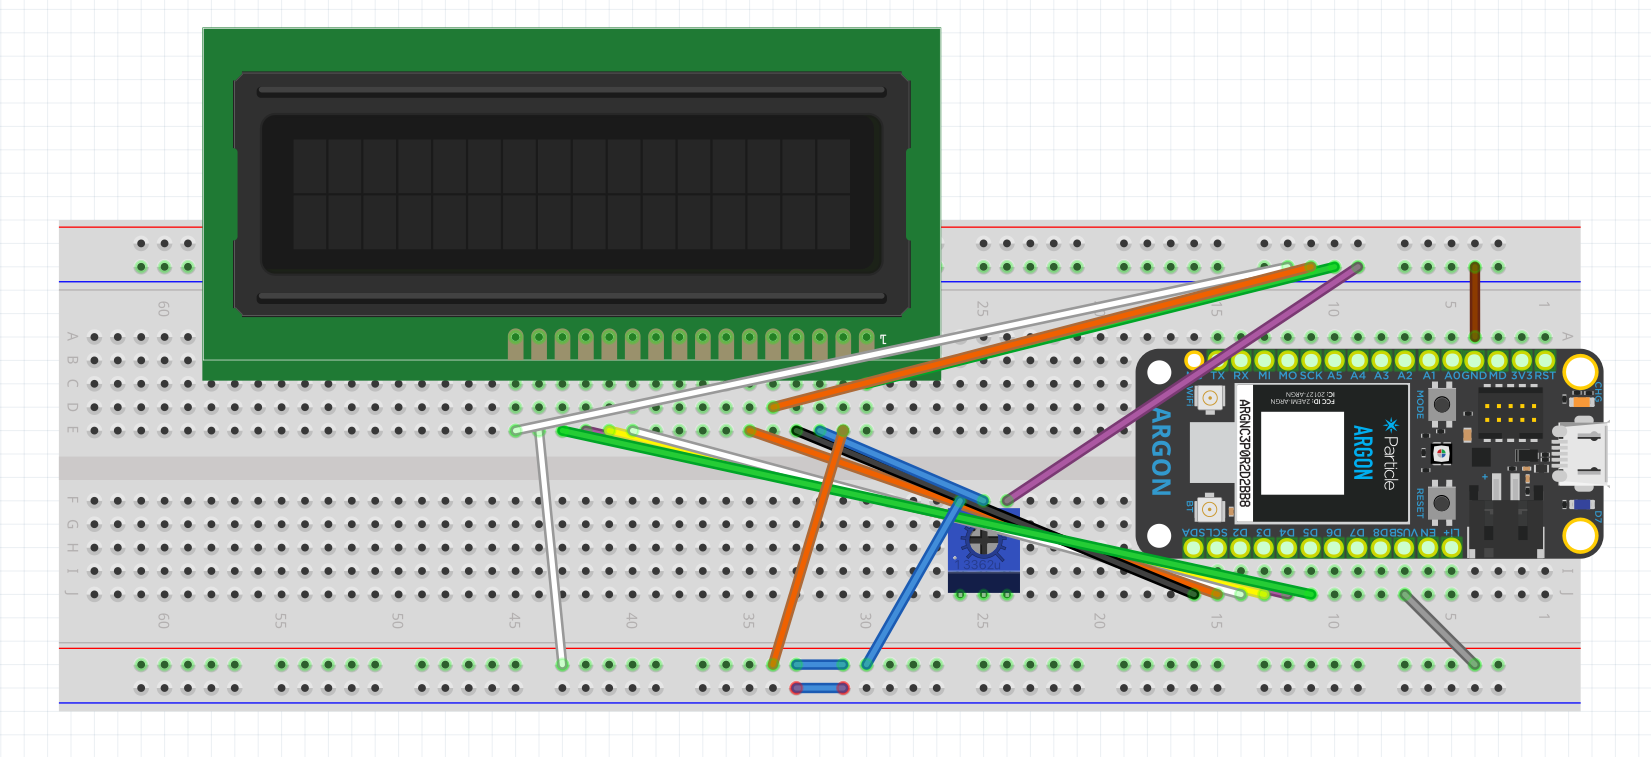
Argon-DisplayIndicator
The liquid crystal display (LCD) can display both the temperature of the water and the water level in the drip pan. The water level read out is "low, " "mid, " or "high, " where low indicates a low and safe water level, mid indicates a rising water level, and high represents a high water level which needs to be quickly evaluated. The temperature and water level are constantly updating to reflect the most recent output.
The display indicator from another view to clarify the wire placement.
The display indicator brightness level is adjusted by the twist of a potentiometer. View the video below to see the brightness level adjustment.
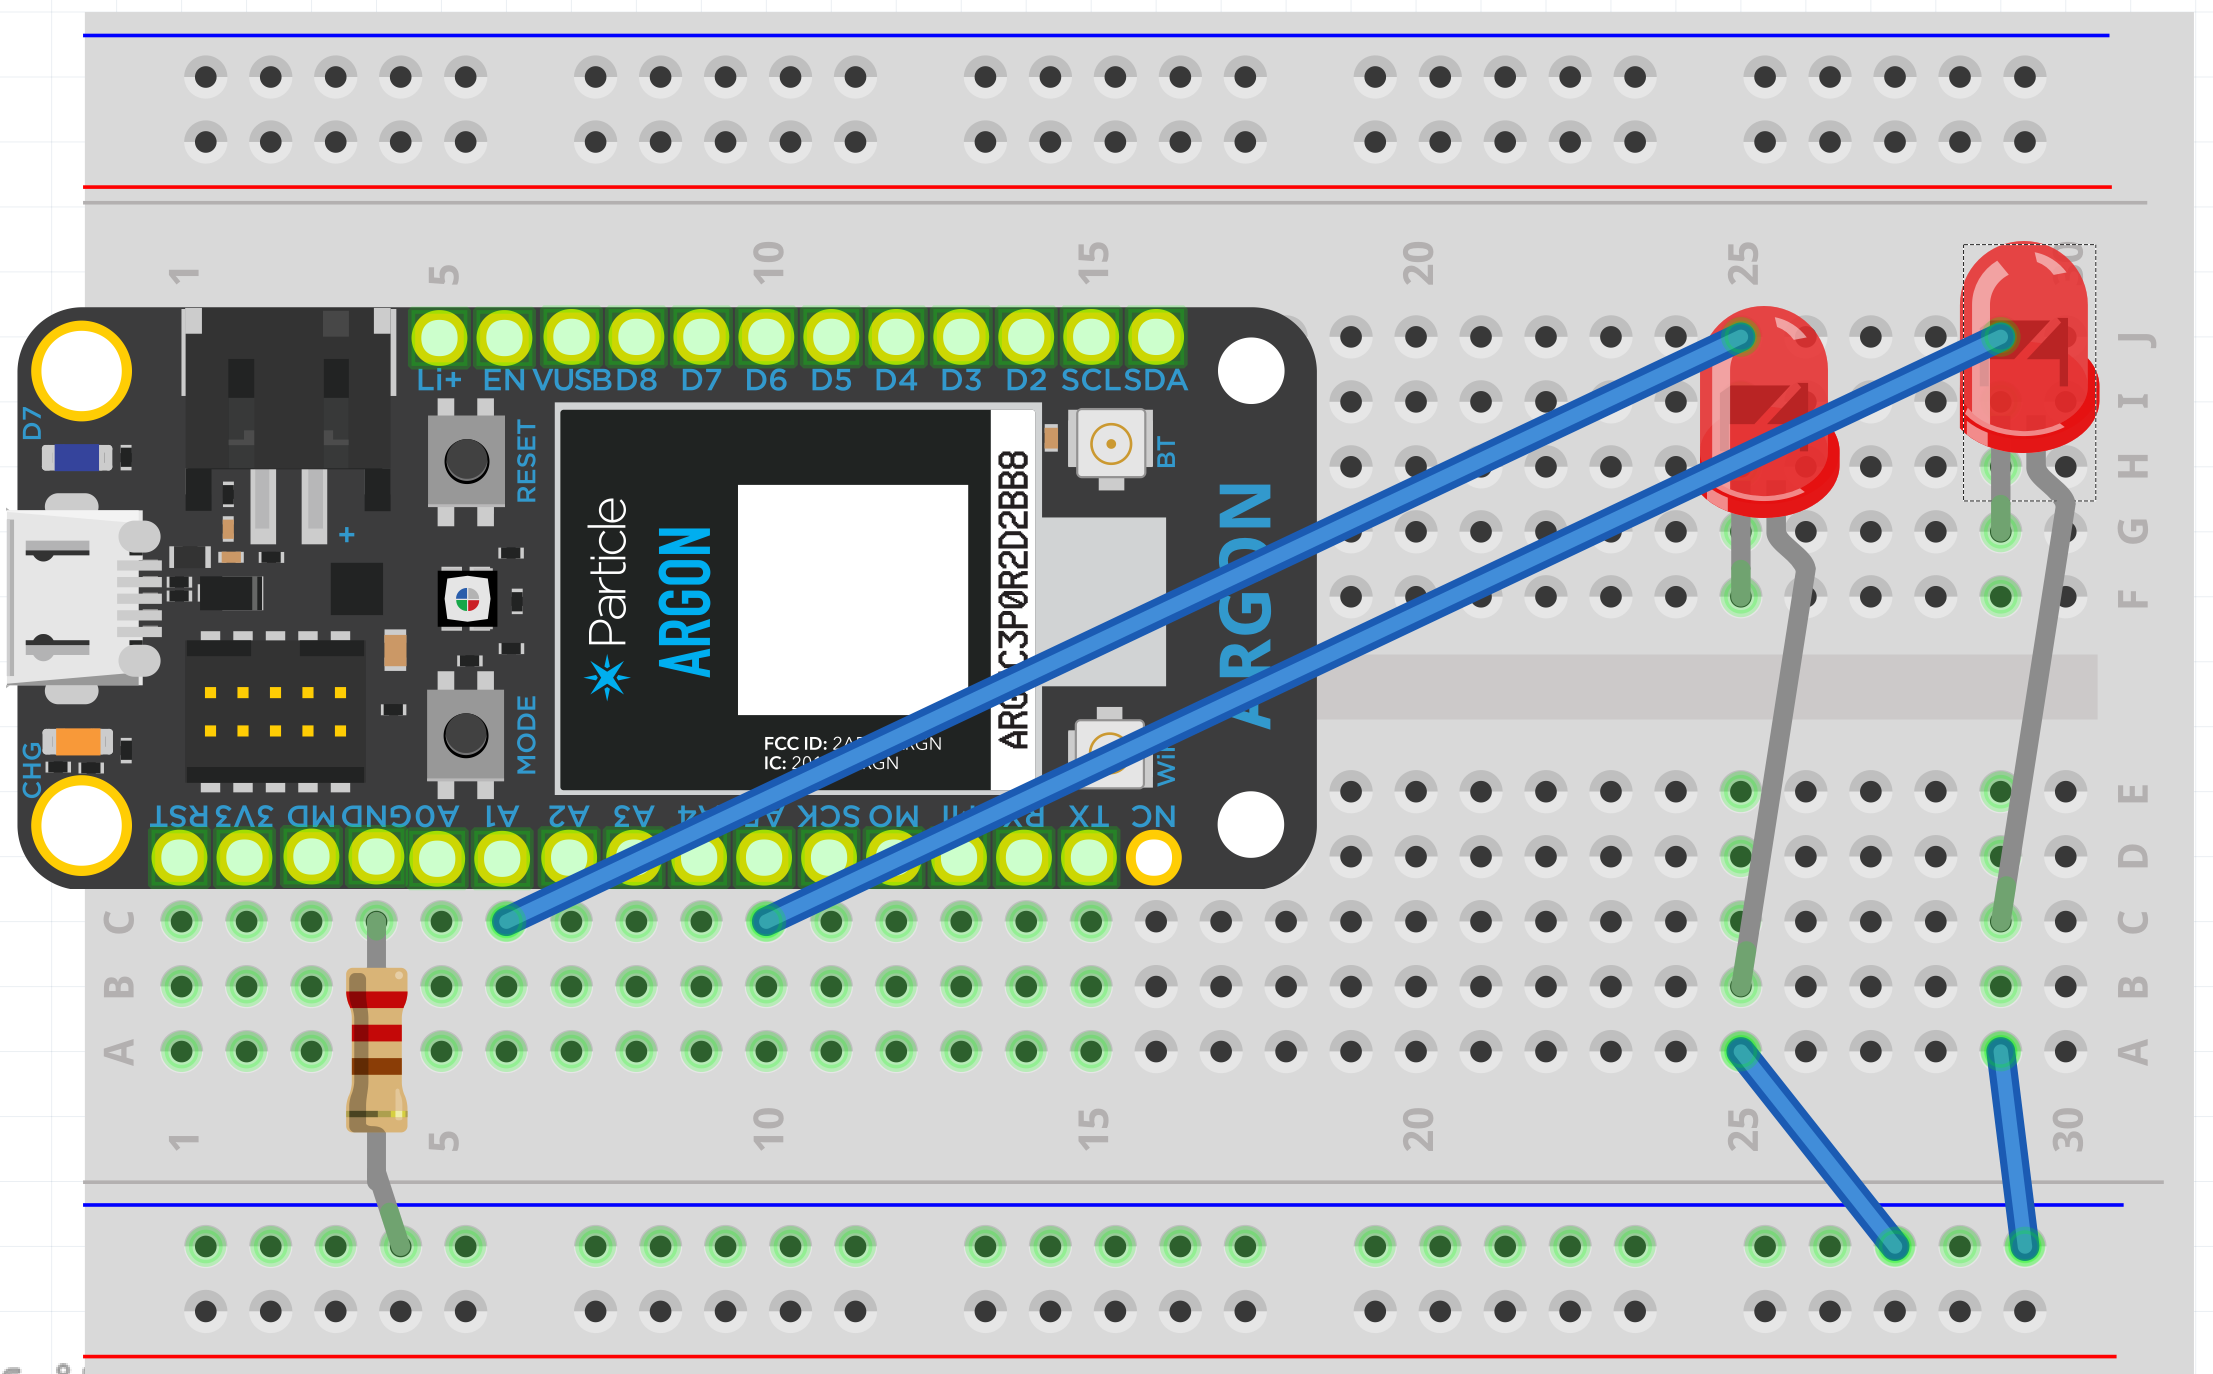
Argon-LEDIndicators
The LED's were utilized as second-source indicators which display a "green" or "red" light. Green means low water level. Red means either medium or high water level, and further attention is required.
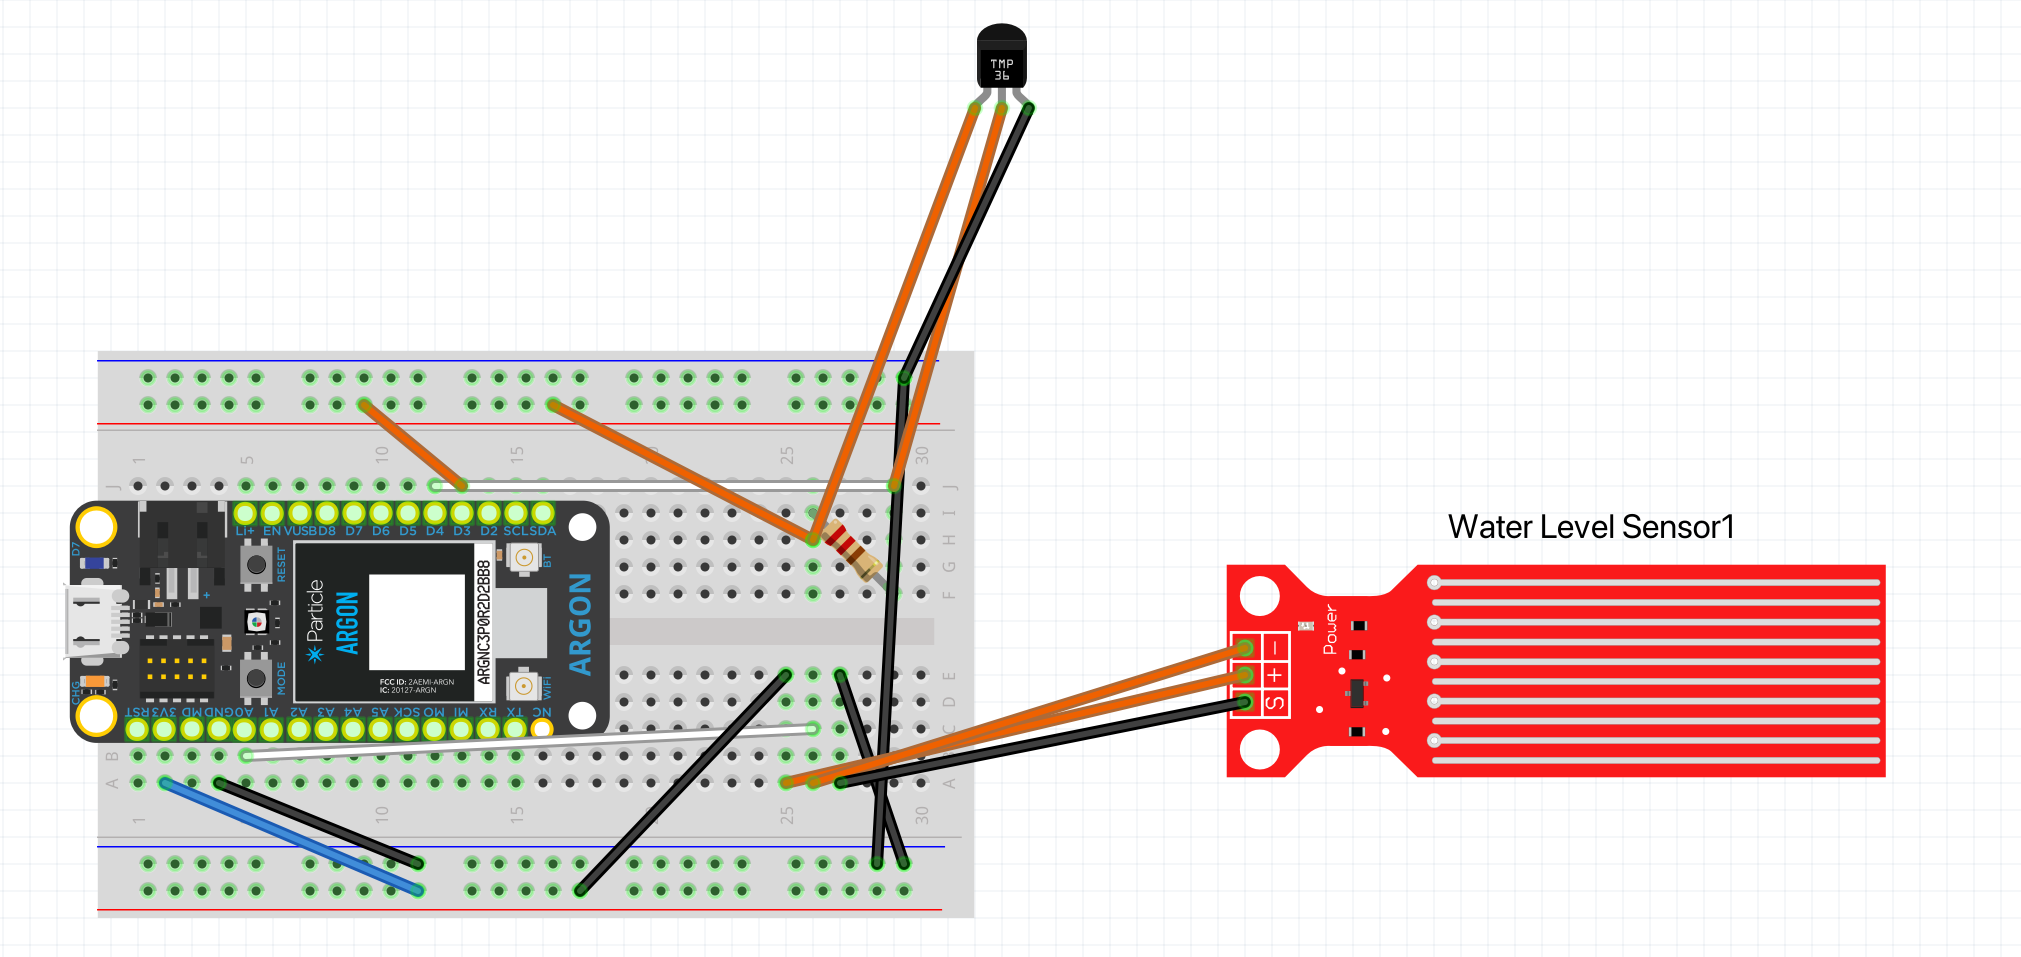
Argon-WaterLevel&TemperatureSensors
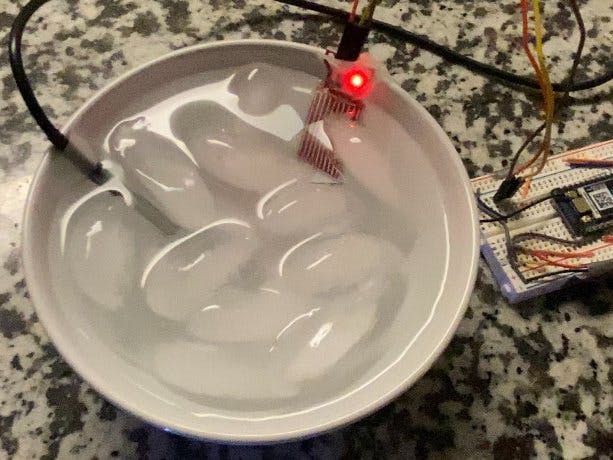
The Water Level and Temperature sensors were the key component to our project. The water level sensor was hooked up to the argon and then secured inside of the bowl in order to detect water levels on a rise or drop. The temperature sensor is a waterproof probe which was also secured inside the bowl and updated the temperature read-out continuously to a two-decimal place accuracy.
Another feature of our Water Level and Temperature sensing system is that this data updates live. We utilized a program titled ThingSpeak, which updates the data live on a chart. This data includes the water level and temperature of the environment where the sensors are placed. This data only updates when the argon is online, so we ran another experiment exactly like the one conducted in the video above. We increased the water level first which activated high read-outs from the water level sensor, followed by some ice to activate a decline in temperature read-out from the temperature sensor. The graphs can be seen here, but are also put below for convenience. Additionally, we have added a video which highlights the live updates for the graphs below.


Comments
Please log in or sign up to comment.