Have you ever walked to class in the freezing cold, three layers deep in sweatshirts, only to find that your classroom thermostat is set to 85 degrees? Our IOT Project, the Average Temperature Calculator, serves as a solution to the drastic issues faced by our engineering students every fall semester. The Average Temperature Calculator allows one to know the average temperature between two distant locations (both inside and out) and dress accordingly.
This project starts off by having two Particle photons recording temperatures via separate temperature sensors, and then sending this data to the cloud.
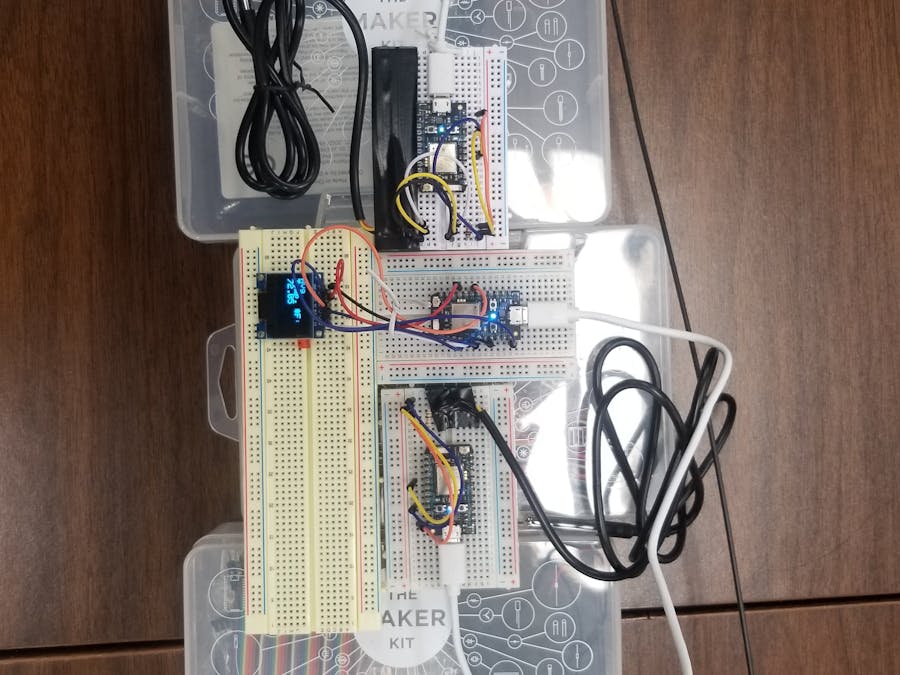
Figure 1: First and Second Photon Setup
Each photon records temperature every 10 seconds and updates in real time to a spreadsheet in Google sheets. Below are the two graphs of the temperature in real time for the first and second photon; this is done through a connected IFTTT applet.
Figure 2: IFTTT Applet Screenshot
Figure 3: Temperature vs Time (First Photon)
Click the link below to view live data from photon 1
The blue line in the above figure represents temperature data from Particle 1, the red line represents temperature data from Particle 2, and the gold line represents the average temperature over the time period.
This data is published into two separate events, to which the third/central photon subscribes to. Once subscribed, the photon takes in the string character data and converts it to floating integer data so that the average between the two temperatures can be calculated. This average temperature is finally displayed on the OLED screen; after the average temperature is displayed a second event titled “Average Temperature” is published from the third photon. The first and second photon subscribe to this event and flash the D7 output every time the average is calculated.
Figure 6: Third/Central Photon Setup
Figure 7: First, Second, and Third/Central Photon Setup
// This #include statement was automatically added by the Particle IDE.#include<OneWire.h>OneWireds=OneWire(D4);// 1-wire signal on pin D4//This code allows for a photon to take the temperature and then publish the data to the cloud as an event. This photon also subscribed to an Average event; this event is coming from the third photon. //Everytime the average temperature is displayed on the OLED, D7 will light up. (This completes the bi-directional communication)unsignedlonglastUpdate=0;floatlastTemp;voidsetup(){Serial.begin(9600);// Set up 'power' pins, comment out if not used!pinMode(D3,OUTPUT);pinMode(D5,OUTPUT);pinMode(D7,OUTPUT);digitalWrite(D3,LOW);digitalWrite(D5,HIGH);digitalWrite(D7,LOW);Particle.subscribe("Average1",recordAverage,"1d002d001247343438323536");//Subscribe to the Average event being published by the third photon}voidrecordAverage(constchar*Average1,constchar*data3){digitalWrite(D7,HIGH);//Tell the photon to flash D7 on high when the Average event is publisheddelay(1000);//Delay the responsedigitalWrite(D7,LOW);//After D7 has flashed turn it off}voidloop(void){bytei;bytepresent=0;bytetype_s;bytedata[12];byteaddr[8];floatcelsius,fahrenheit;if(!ds.search(addr)){Serial.println("No more addresses.");Serial.println();ds.reset_search();delay(250);return;}// The order is changed a bit in this example// first the returned address is printedSerial.print("ROM =");for(i=0;i<8;i++){Serial.write(' ');Serial.print(addr[i],HEX);}// second the CRC is checked, on fail,// print error and just return to try againif(OneWire::crc8(addr,7)!=addr[7]){Serial.println("CRC is not valid!");return;}Serial.println();// we have a good address at this point// what kind of chip do we have?// we will set a type_s value for known types or just return// the first ROM byte indicates which chipswitch(addr[0]){case0x10:Serial.println(" Chip = DS1820/DS18S20");type_s=1;break;case0x28:Serial.println(" Chip = DS18B20");type_s=0;break;case0x22:Serial.println(" Chip = DS1822");type_s=0;break;case0x26:Serial.println(" Chip = DS2438");type_s=2;break;default:Serial.println("Unknown device type.");return;}// this device has temp so let's read itds.reset();// first clear the 1-wire busds.select(addr);// now select the device we just found// ds.write(0x44, 1); // tell it to start a conversion, with parasite power on at the endds.write(0x44,0);// or start conversion in powered mode (bus finishes low)// just wait a second while the conversion takes place// different chips have different conversion times, check the specs, 1 sec is worse case + 250ms// you could also communicate with other devices if you like but you would need// to already know their address to select them.delay(1000);// maybe 750ms is enough, maybe not, wait 1 sec for conversion// we might do a ds.depower() (parasite) here, but the reset will take care of it.// first make sure current values are in the scratch padpresent=ds.reset();ds.select(addr);ds.write(0xB8,0);// Recall Memory 0ds.write(0x00,0);// Recall Memory 0// now read the scratch padpresent=ds.reset();ds.select(addr);ds.write(0xBE,0);// Read Scratchpadif(type_s==2){ds.write(0x00,0);// The DS2438 needs a page# to read}// transfer and print the valuesSerial.print(" Data = ");Serial.print(present,HEX);Serial.print(" ");for(i=0;i<9;i++){// we need 9 bytesdata[i]=ds.read();Serial.print(data[i],HEX);Serial.print(" ");}Serial.print(" CRC=");Serial.print(OneWire::crc8(data,8),HEX);Serial.println();// Convert the data to actual temperature// because the result is a 16 bit signed integer, it should// be stored to an "int16_t" type, which is always 16 bits// even when compiled on a 32 bit processor.int16_traw=(data[1]<<8)|data[0];if(type_s==2)raw=(data[2]<<8)|data[1];bytecfg=(data[4]&0x60);switch(type_s){case1:raw=raw<<3;// 9 bit resolution defaultif(data[7]==0x10){// "count remain" gives full 12 bit resolutionraw=(raw&0xFFF0)+12-data[6];}celsius=(float)raw*0.0625;break;case0:// at lower res, the low bits are undefined, so let's zero themif(cfg==0x00)raw=raw&~7;// 9 bit resolution, 93.75 msif(cfg==0x20)raw=raw&~3;// 10 bit res, 187.5 msif(cfg==0x40)raw=raw&~1;// 11 bit res, 375 ms// default is 12 bit resolution, 750 ms conversion timecelsius=(float)raw*0.0625;break;case2:data[1]=(data[1]>>3)&0x1f;if(data[2]>127){celsius=(float)data[2]-((float)data[1]*.03125);}else{celsius=(float)data[2]+((float)data[1]*.03125);}}// remove random errorsif((((celsius<=0&&celsius>-1)&&lastTemp>5))||celsius>125){celsius=lastTemp;}fahrenheit=celsius*1.8+32.0;lastTemp=celsius;Serial.print(" Temperature = ");Serial.print(celsius);Serial.print(" Celsius, ");Serial.print(fahrenheit);Serial.println(" Fahrenheit");// now that we have the readings, we can publish them to the cloudStringtemperature=String(fahrenheit);// store temp in "temperature" stringParticle.publish("temperature1",temperature);// publish to clouddelay(10000);// 10 second delay}
2nd Photon recording temperature
C/C++
// This #include statement was automatically added by the Particle IDE.#include<OneWire.h>// This #include statement was automatically added by the Particle IDE.#include<OneWire.h>//This code allows for a photon to take the temperature and then publish the data to the cloud as an event. This photon also subscribed to an Average event; this event is coming from the third photon. //Everytime the average temperature is displayed on the OLED, D7 will light up. (This completes the bi-directional communication)OneWireds=OneWire(D4);// 1-wire signal on pin D4unsignedlonglastUpdate=0;floatlastTemp;voidsetup(){Serial.begin(9600);// Set up 'power' pins, comment out if not used!pinMode(D3,OUTPUT);pinMode(D5,OUTPUT);pinMode(D7,OUTPUT);digitalWrite(D3,LOW);digitalWrite(D5,HIGH);digitalWrite(D7,LOW);Particle.subscribe("Average1",recordAverage,"1d002d001247343438323536");//Subscribe to the Average event being published by the third photon}voidrecordAverage(constchar*Average1,constchar*data3){digitalWrite(D7,HIGH);//Tell the photon to flash D7 on high when the Average event is publisheddelay(1000);digitalWrite(D7,LOW);//After D7 has flashed turn it off}// up to here, it is the same as the address acanner// we need a few more variables for this examplevoidloop(void){bytei;bytepresent=0;bytetype_s;bytedata[12];byteaddr[8];floatcelsius,fahrenheit;if(!ds.search(addr)){Serial.println("No more addresses.");Serial.println();ds.reset_search();delay(250);return;}// The order is changed a bit in this example// first the returned address is printedSerial.print("ROM =");for(i=0;i<8;i++){Serial.write(' ');Serial.print(addr[i],HEX);}// second the CRC is checked, on fail,// print error and just return to try againif(OneWire::crc8(addr,7)!=addr[7]){Serial.println("CRC is not valid!");return;}Serial.println();// we have a good address at this point// what kind of chip do we have?// we will set a type_s value for known types or just return// the first ROM byte indicates which chipswitch(addr[0]){case0x10:Serial.println(" Chip = DS1820/DS18S20");type_s=1;break;case0x28:Serial.println(" Chip = DS18B20");type_s=0;break;case0x22:Serial.println(" Chip = DS1822");type_s=0;break;case0x26:Serial.println(" Chip = DS2438");type_s=2;break;default:Serial.println("Unknown device type.");return;}// this device has temp so let's read itds.reset();// first clear the 1-wire busds.select(addr);// now select the device we just found// ds.write(0x44, 1); // tell it to start a conversion, with parasite power on at the endds.write(0x44,0);// or start conversion in powered mode (bus finishes low)// just wait a second while the conversion takes place// different chips have different conversion times, check the specs, 1 sec is worse case + 250ms// you could also communicate with other devices if you like but you would need// to already know their address to select them.delay(1000);// maybe 750ms is enough, maybe not, wait 1 sec for conversion// we might do a ds.depower() (parasite) here, but the reset will take care of it.// first make sure current values are in the scratch padpresent=ds.reset();ds.select(addr);ds.write(0xB8,0);// Recall Memory 0ds.write(0x00,0);// Recall Memory 0// now read the scratch padpresent=ds.reset();ds.select(addr);ds.write(0xBE,0);// Read Scratchpadif(type_s==2){ds.write(0x00,0);// The DS2438 needs a page# to read}// transfer and print the valuesSerial.print(" Data = ");Serial.print(present,HEX);Serial.print(" ");for(i=0;i<9;i++){// we need 9 bytesdata[i]=ds.read();Serial.print(data[i],HEX);Serial.print(" ");}Serial.print(" CRC=");Serial.print(OneWire::crc8(data,8),HEX);Serial.println();// Convert the data to actual temperature// because the result is a 16 bit signed integer, it should// be stored to an "int16_t" type, which is always 16 bits// even when compiled on a 32 bit processor.int16_traw=(data[1]<<8)|data[0];if(type_s==2)raw=(data[2]<<8)|data[1];bytecfg=(data[4]&0x60);switch(type_s){case1:raw=raw<<3;// 9 bit resolution defaultif(data[7]==0x10){// "count remain" gives full 12 bit resolutionraw=(raw&0xFFF0)+12-data[6];}celsius=(float)raw*0.0625;break;case0:// at lower res, the low bits are undefined, so let's zero themif(cfg==0x00)raw=raw&~7;// 9 bit resolution, 93.75 msif(cfg==0x20)raw=raw&~3;// 10 bit res, 187.5 msif(cfg==0x40)raw=raw&~1;// 11 bit res, 375 ms// default is 12 bit resolution, 750 ms conversion timecelsius=(float)raw*0.0625;break;case2:data[1]=(data[1]>>3)&0x1f;if(data[2]>127){celsius=(float)data[2]-((float)data[1]*.03125);}else{celsius=(float)data[2]+((float)data[1]*.03125);}}// remove random errorsif((((celsius<=0&&celsius>-1)&&lastTemp>5))||celsius>125){celsius=lastTemp;}fahrenheit=celsius*1.8+32.0;lastTemp=celsius;Serial.print(" Temperature = ");Serial.print(celsius);Serial.print(" Celsius, ");Serial.print(fahrenheit);Serial.println(" Fahrenheit");// now that we have the readings, we can publish them to the cloudStringtemperature=String(fahrenheit);// store temp in "temperature" stringParticle.publish("temperature2",temperature);// publish to clouddelay(10000);// 10 second delay}
3rd photon taking the average of the two recorded temperatures
C/C++
// This #include statement was automatically added by the Particle IDE.#include<Adafruit_SSD1306.h>#define OLED_DC D3#define OLED_CS D4#define OLED_RESET D5staticAdafruit_SSD1306display(OLED_DC,OLED_RESET,OLED_CS);//This code allows for one photon to subscirbe to two events of temperature data. The data is then combined by taking the average and displayed on an OLED screen. //When the average is taken an event is also published so that the other two photons can flash D7 letting us know that the average temperature was taken.chartemp[9];floatAvg=0;//Make floating so that we can use it to do calculations belowfloatTemp1=0;//Make floating so that we can use it to do calculations belowfloatTemp2=0;//Make floating so that we can use it to do calculations belowvoidsetup(){Particle.subscribe("temperature2",recordtemp2,"2e003f000c47343438323536");//Subscribing to the second photon recording the temp.Particle.subscribe("temperature1",recordtemp1,"27002a000b47363330353437");//Subscribing to the first photon recording the temp.display.begin(SSD1306_SWITCHCAPVCC);display.clearDisplay();display.display();}voidrecordtemp1(constchar*temperature1,constchar*data1)//void is a function command{Temp1=atof(data1);//Convert the character data coming in to string data and assign the string data to the floating variable Temp1 }voidrecordtemp2(constchar*temperature2,constchar*data2){Temp2=atof(data2);Avg=((Temp1+Temp2)/2);//Take the average of the incoming temperature datadisplay.clearDisplay();display.setTextColor(WHITE);display.setTextSize(2);display.setCursor(0,0);display.println("Avg.");display.println("Temp. *F:");display.println(Avg);//Display the average temperature on the OLEDdisplay.display();StringAverage=String(Avg);// store temp in "temperature" stringParticle.publish("Average1",Average);//Publish the Average temperature calculated for the other two photons to subscribe todelay(10000);display.clearDisplay();}


_3u05Tpwasz.png?auto=compress%2Cformat&w=40&h=40&fit=fillmax&bg=fff&dpr=2)
Comments
Please log in or sign up to comment.