


Hardware components | ||||||
 |
| × | 1 | |||
 |
| × | 1 | |||
 |
| × | 1 | |||
 |
| × | 1 | |||
Software apps and online services | ||||||
 |
| |||||
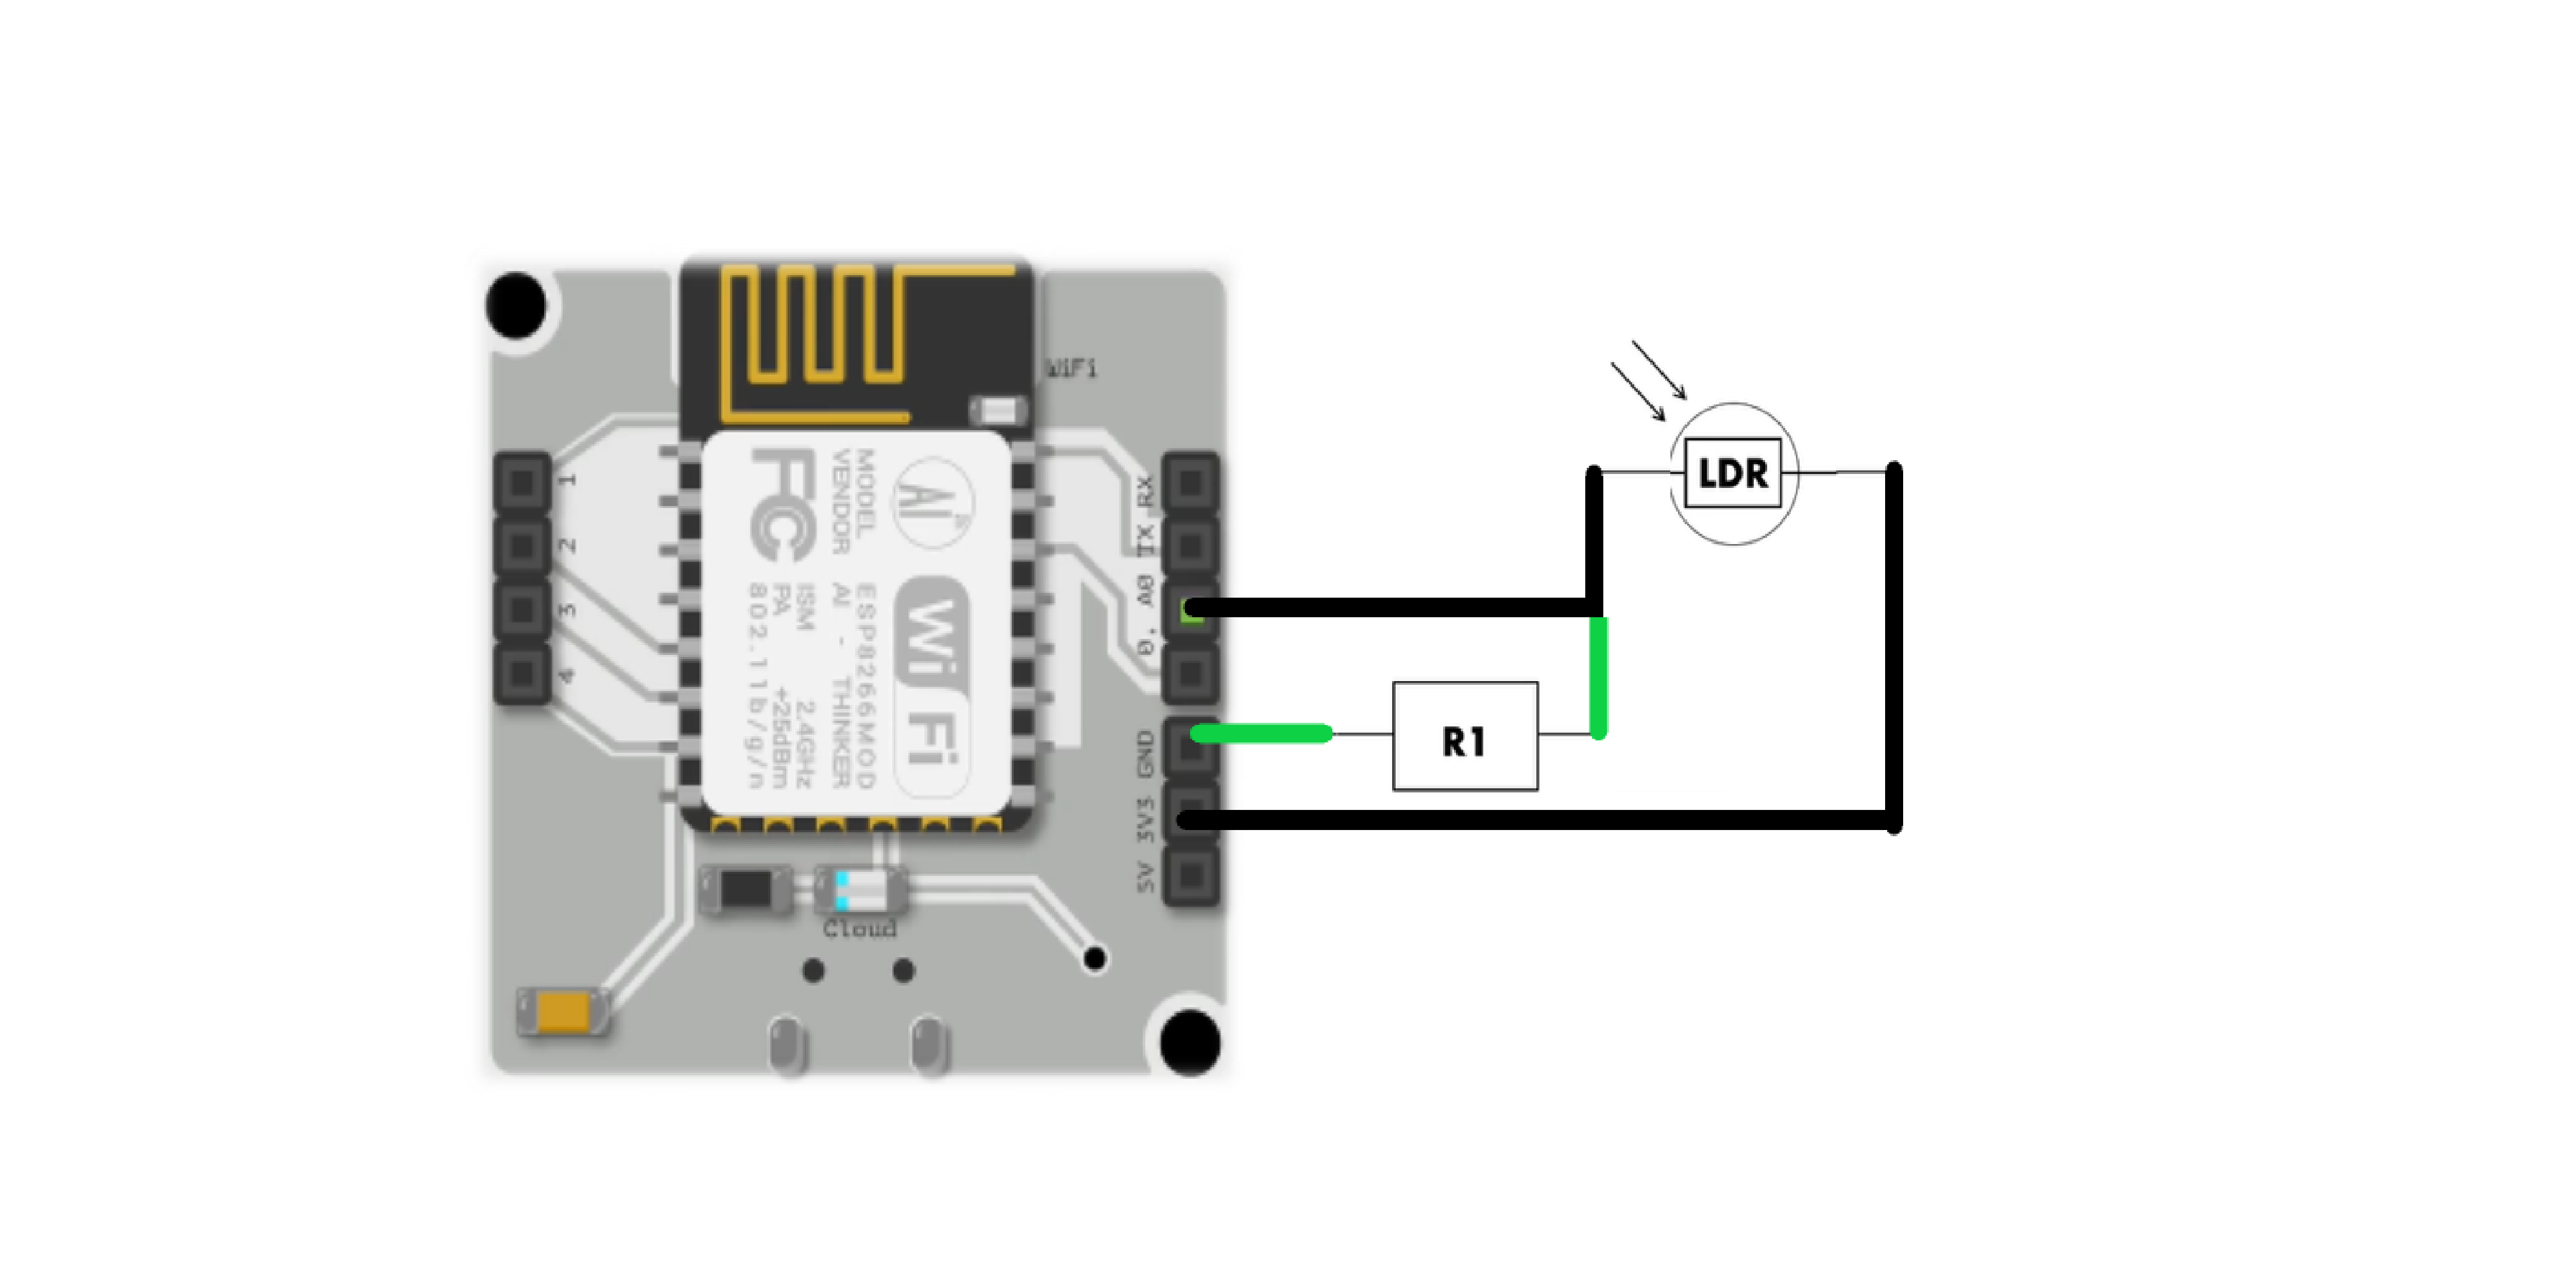
Light Dependent Resistor or an LDR is a sensor that can be used to see how much light is at any location. The internal resistance of LDR changes depending upon the intensity of light falling on it. It is connected to the Analogue input pin.
The change in resistance coming from LDR can be converted into a change in voltage by using the Voltage Divider Circuit.
It is used to break the supplied voltage into smaller components across its length.
The arm with the higher resistance pulls more voltage and the arm with the lower resistance pulls less. The reason for this is that when the current flowing across two ends in a circuit is constant, the voltage between those points is directly proportional to the resistance between those two points, according to Ohm’s Law.
When current is constant,
Where V is the voltage, I is the Current, and R is the Resistance.
When the intensity of light increases on LDR, the resistance increases, and the voltage increases as well.
This data that is collected by the LDR will be sent to bolt cloud.
When the light intensity on the LDR increases, the resistance decreases as the resistance is inversely proportional to the intensity of light.
MethodologyHere, one pin of the LDR is connected to the 3x3 pin and the other is connected to the AO pin. The resistor is connected to GND on one side and AO on the other side.
The GND and 3x3 pins should not touch each other or it will result in a short circuit and the Wi-Fi module will be damaged.
These configurations must be made in the Hardware section after the product has been set up.
plotChart("time_stamp", "light");Write the above code, give the name of your choice and select JS as your file type.
These configurations must be made in the Code section of the cloud console.
This is how the module looks when it is turned on and connected to the cloud.
The above are the data points it has captured.
To use Google’s Library in this, the following commands need to be added in the previous code.
setChartLibrary("google-chart");
setChartType("lineGraph");
plotChart("time_stamp", "light");
Using the Google Chart Library, we can plot a line graph for this data.
After adding some labels using the following commands, this is how the final graph looks like.
setChartLibrary("google-chart");
setChartTitle("Light Intensity Monitor");
setAxisName("Time", "Light Intensity");
setCrosshair("true");
setChartType("areaGraph");
plotChart("time_stamp", "light");High five if you followed this tutorial till here!

Comments
Please log in or sign up to comment.