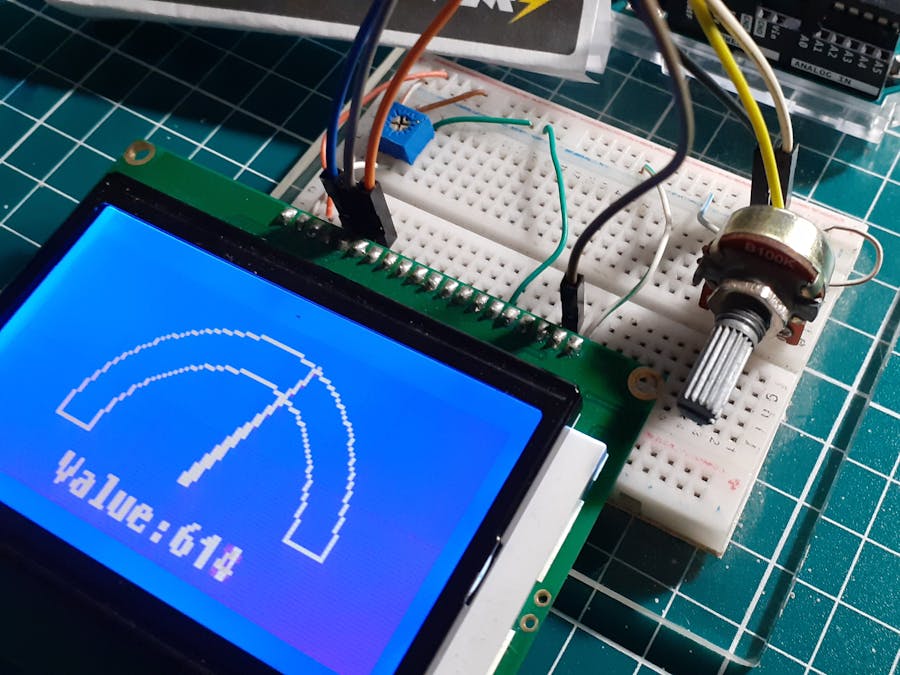
I continue my series of projects where I only perform the reading of a potentiometer and represent it in a different way, this time I show the numerical value using a gauge graph, that is why the best option is the use of a 128x64 LCD display and the U8g2 graphic library.
Remember to read the previous post: 8xLEDs,8x8 LEDs matrix,7-segments display,4-digit 7-segment display,16x2 LCD and 16x4 LCD.
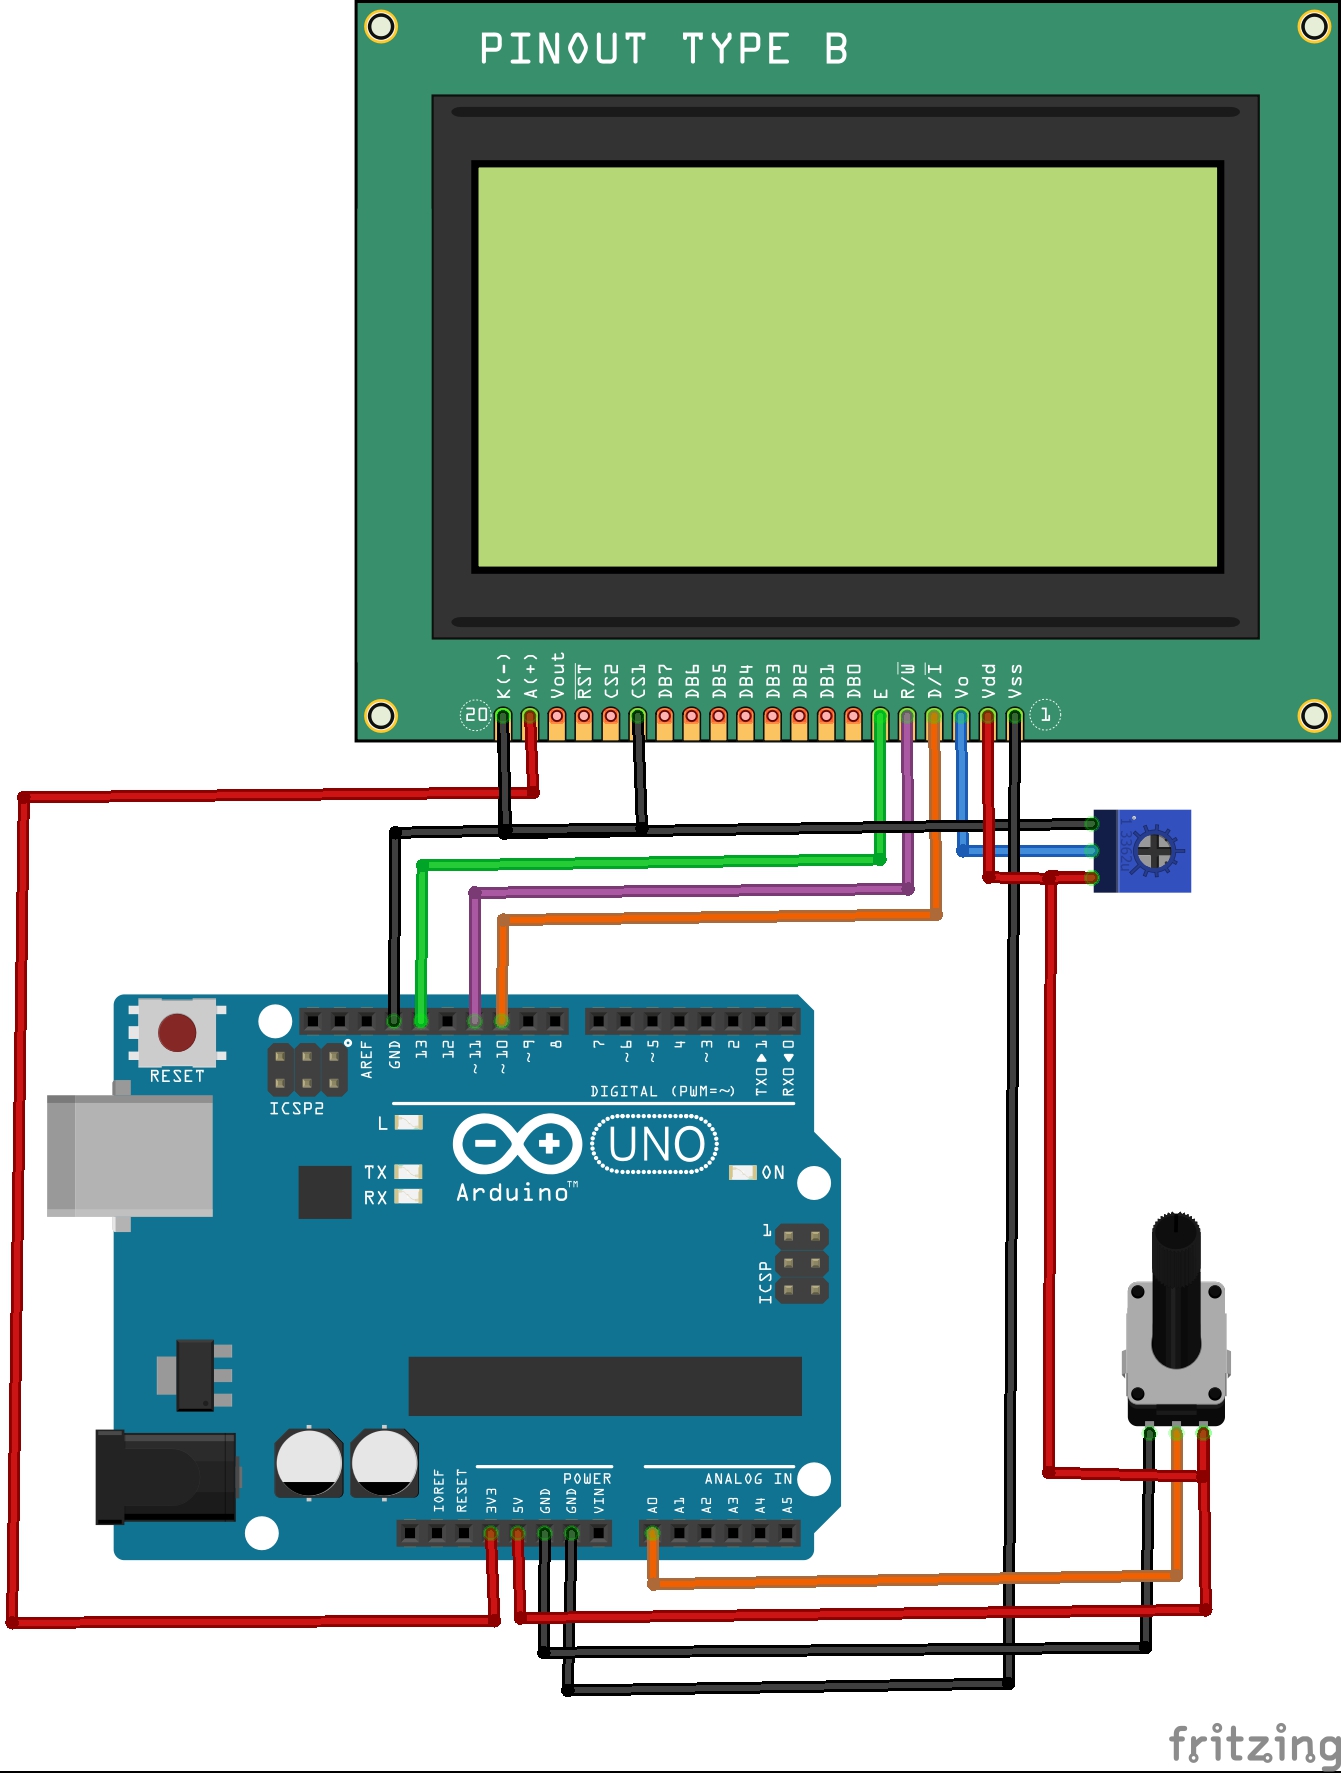
DiagramIt is good to always start from the identification of each pin of the LCD, it is important to take into account that it has 20 pins. See the picture.
It is time to make the connections, pay close attention to detail with the potentiometer on the LCD and adjust its value to appreciate the letters.
Now, you must install the U8g2 library and then perform the graphic test, it is important to verify the correct connection and even add the following configuration line in the code:
U8G2_ST7920_128X64_1_SW_SPI u8g2(U8G2_R0, /* clock=*/ 13 /* A4 */ , /* data=*/ 11 /* A2 */, /* CS=*/ 10 /* A3 */, /* reset=*/ U8X8_PIN_NONE);We include the two basic libraries to use the LCD. Take care if the SPI connection is used, we must include the corresponding library and in the case of working with I2c, the Wire library is included.
#include <Arduino.h>
#include <U8g2lib.h>

#ifdef U8X8_HAVE_HW_SPI
#include <SPI.h>
#endif
#ifdef U8X8_HAVE_HW_I2C
#include <Wire.h>
#endif
We need to declare the display connection pins, CLK on pin 13, data on 11 and CS on pin 10. Check the connection diagram.
U8G2_ST7920_128X64_1_SW_SPI u8g2(U8G2_R0, /* clock=*/ 13 /* A4 */ , /* data=*/ 11 /* A2 */, /* CS=*/ 10 /* A3 */, /* reset=*/ U8X8_PIN_NONE);The necessary variables must be created to plot the elements. We start with the variables that contain the angles of the scale in radians, coordinates of the center of the circumference, the radius of the external and internal elements, the percentage of the radius that will be used for the length of the needle and the variable to store the reading of the potentiometer.
float gs_rad; //stores angle from where to start in radinats
float ge_rad; //stores angle where to stop in radinats

byte cx=64; //x center
byte cy=45; //y center
byte radius=40; //radius
byte radius2=30; //radius
byte percent=80; //needle percent
int pot = 0;
The plot function is the heart of the program, it uses the necessary variables to generate the graph, first from the semicircles of the scale through the drawCircle function, followed by the lateral's limit lines. The lower numerical value of the graph is printed and the interpolation is performed to calculate the angle of the needle according to the numerical value (between 0 and 1020), this value is converted to radians to continue. By obtaining this angle, the coordinates of the point of the needle can be calculated (thanks to Uncle Pythagoras), now, a set of lines are added to give thickness to the needle. Remark: I found it acceptable this way, but if you decide to change the line creation to add triangles, please share with us in the comments.
void Drawgauge(int x, byte y, byte r, byte p, int v, int minVal, int maxVal) {
  u8g2.firstPage();
  do {
    u8g2.drawCircle(x,y,r, U8G2_DRAW_UPPER_LEFT|U8G2_DRAW_UPPER_RIGHT );
    u8g2.drawCircle(x,y,radius2, U8G2_DRAW_UPPER_LEFT|U8G2_DRAW_UPPER_RIGHT );
    u8g2.drawLine(cx-r, cy, cx-radius2, cy);
    u8g2.drawLine(cx+r, cy, cx+radius2, cy);
    u8g2.setDrawColor(1);
    u8g2.drawStr(x-30,y+15,"Value:");
    u8g2.setCursor(x+7,y+15);
    u8g2.print(pot);
    float val = map(pot, 0, 1020, 0, 180);
    val = val*3.14/180 -1.572;
    int xp = x+(sin(val) * radius);
    int yp = y-(cos(val) * radius);
    u8g2.drawLine(x,y,xp,yp);
    u8g2.drawLine(x-1,y-1,xp,yp);
    u8g2.drawLine(x+1,y-1,xp,yp);
    u8g2.drawLine(x-1,y,xp,yp);
    u8g2.drawLine(x+1,y,xp,yp);
  } while ( u8g2.nextPage() );
}
In the setup we start the screen, we establish the type of font to use and the rotation of the screen.
void setup() {
  u8g2.begin();
  u8g2.setFont(u8g2_font_t0_12b_te);
  u8g2.setDisplayRotation(U8G2_R2);
}
The loop is totally simple, we must read the analog pin and then activate the graphing function.
void loop() {
  pot = analogRead(A0);
  Drawgauge(cx,cy,radius,percent,pot,0,100);

}This type of representation is very nice with the 128x64 LCD because it allows to generate a more elaborate detail to show the graph, this is due to the facilities obtained by the graphic library, I consider it to be very easy to use and understand. Remember to comment on this project, if you have a similar project or if my information has been useful to you.


_ztBMuBhMHo.jpg?auto=compress%2Cformat&w=48&h=48&fit=fill&bg=ffffff)


Comments
Please log in or sign up to comment.