Objective
The purpose of the project is to create a measurement system to detect Radon in the environment and present the processed data visually through a graphical interface of Lab View. The data is also stored in a spreadsheet file that can be used for further analysis.
Background
Radon is a radioactive gas released from the decay of the radioactive elements such as Uranium, Thorium, and Radium in rocks and soil. There are 39 isotopes and isomers of Radon. Radon-222 is the most abundant isotope and it has a half-life of 3.823 days. Radon-222 is a member of the radioactive decay chain of uranium-238. It can be found in the buildings, i.e. blue light concrete or gas concrete made of alum shale as well as in underground well water. Inhaled Radon in lungs decomposes into polonium-218 and polonium-214, can cause lung-cancer. Highest allowed concentration of Radon in buildings is 200 Bq/m3 (Sweden). A research study by the Environmental Protection Agency (EPA) shows that among annual deaths due to lung cancer, almost 20,000 of them are due to the airborne form of radiation of Radon.
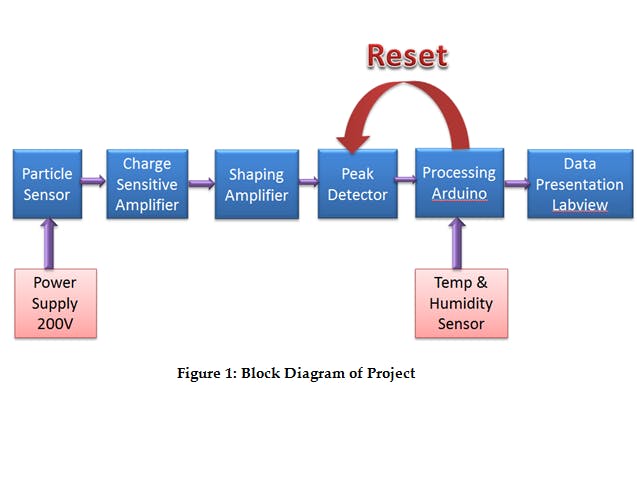
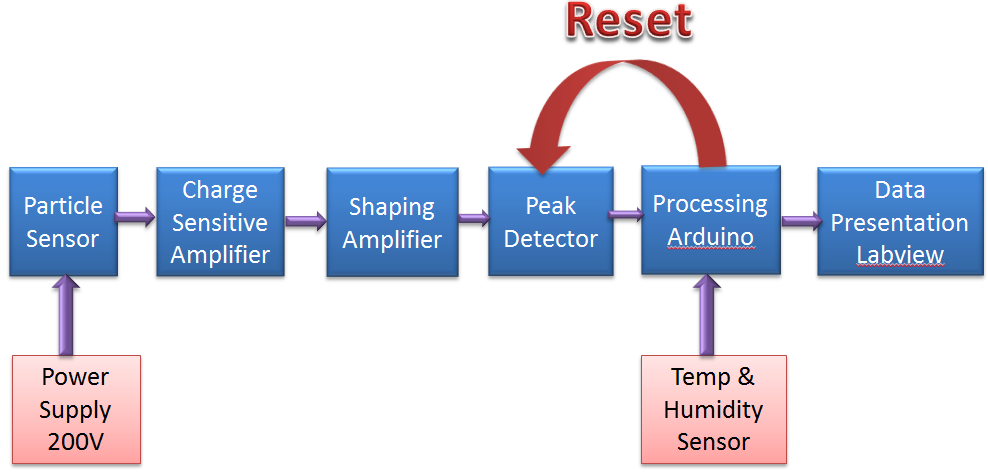
Measurement system for RadonThe block diagram for a Radon detection system is shown in the Figure. A power supply provides 200V to the chamber. The charge sensitive amplifier senses a low signal from the particle detector. The low signal from the charge sensitive amplifier is amplified by a shaping amplifier to produce a signal with high amplitude and a longer time constant. The peak signal is detected by a peak detector which is supplied to the Arduino for processing. RHT03 Sensor is also connected with Arduino to measure the Relative humidity and Temperature of the environment. The visual data is presented through a graphical user interface built in LabView.
Schematic circuit of the power supply
The following figure show as the power supply Implementation design.
Design / Implementation
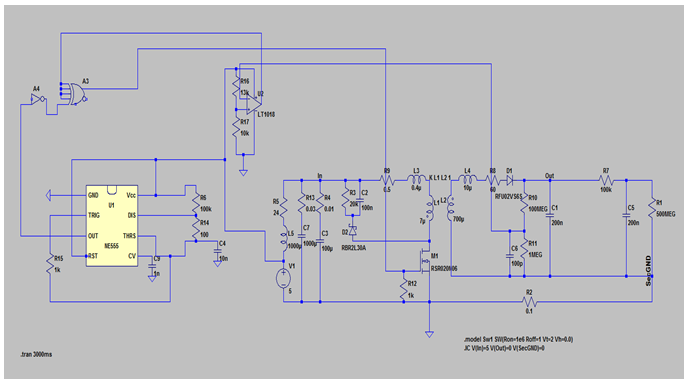
The following LTspice schematic circuit below is used for this project.
Hardware Result
Analogue design
One of the core elements of this project is the analogue amplifier that is the intermediate stage between the sensor and the Arduino board. Its purpose is to amplify the incoming signal from the sensor to measurable levels and sustain the voltage (that indicates the particle energy) long enough for the Arduino to sample it and convey it to the interface. The simulation of the whole circuit was done in Mindi.
Objectives Of Analog Circuit Design
1st: Create the Charge Sensitive Amplifier and simulate it.
2nd: Create the Shaping Amplifier Circuit and simulate it.
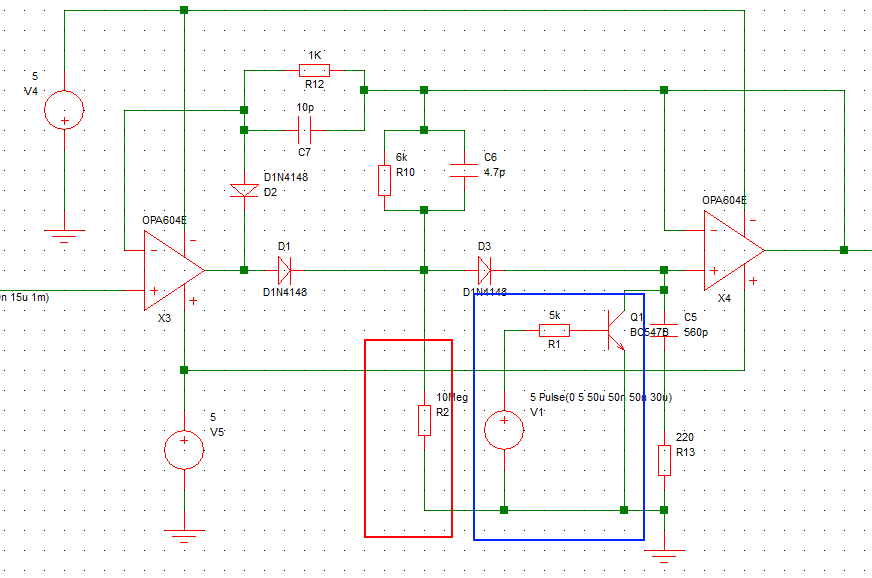
3rd: Create the Peak Detector Circuit and the Reset Part and simulate them.
4th: Creating the Power Supply board and test it.
5th: Creating the amplifier board and test it.
6th: Troubleshooting.
Creating the Charge Sensitive Amplifier
The Charge Sensitive Amplifier (from now on called CSA in the text) is the first step towards our goal of amplifying the sensor signal. It is a design specifically made for radiation detection purposes, as we expect weak charge pulses from the sensor.
A schematic of the circuit is given below.
Creating the Shaping Amplifier
The shaping amplifier is the next stop in the processing of the input signal. Our need in this stage is to make the pulse long enough that the peak detector will be able to “pick it up” and make it suitable for sampling.
Creating the Peak Detector
After creating the desired pulse, we now need the final stage of our circuit, the peak detection. The peak detection is a form of amplitude measurement, as we will find the maximum voltage that is corresponding to a certain input and through that, we can identify the energy of the particle.
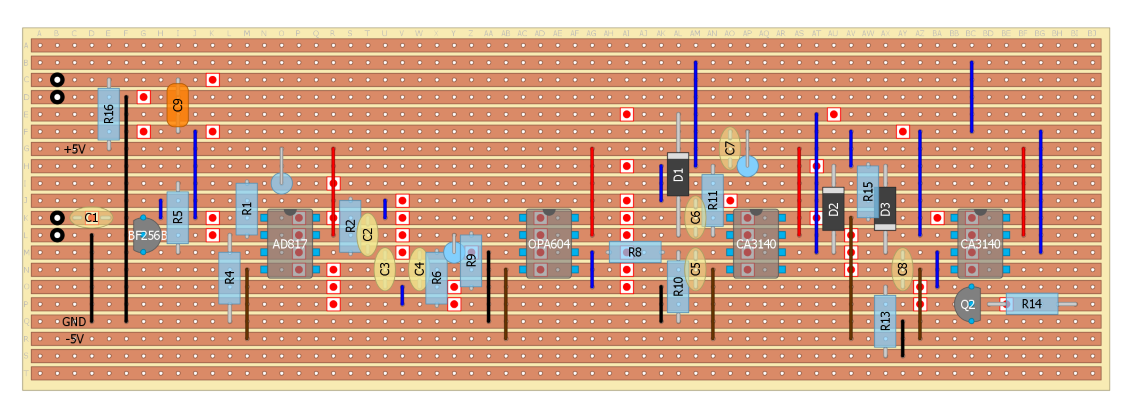
The schematic of Analog board as well as a picture of the board is given below.
Arduino development
Arduino is an open-source prototyping platform based on easy-to-use hardware and software. The open source programming platform of Arduino is called Arduino IDE (Integrated Development Environment).
The Arduino boards read inputs through a sensor and convert it into an output. The instruction to the board is given by writing a code in the Arduino IDE and uploading it to the built-in microcontroller. The programming language is based on Wiring and the Arduino IDE is based on Processing. (Arduino.cc)
Arduino Objective
The goal of this part is to read an Analog input from the peak detector and process the signal according to the threshold values. Temperature and Humidity is also sensed with RHT03 sensor. The processed data from the Arduino is serially transmitted to the graphical user interface application namely Lab view to display the data on a graphical interface.
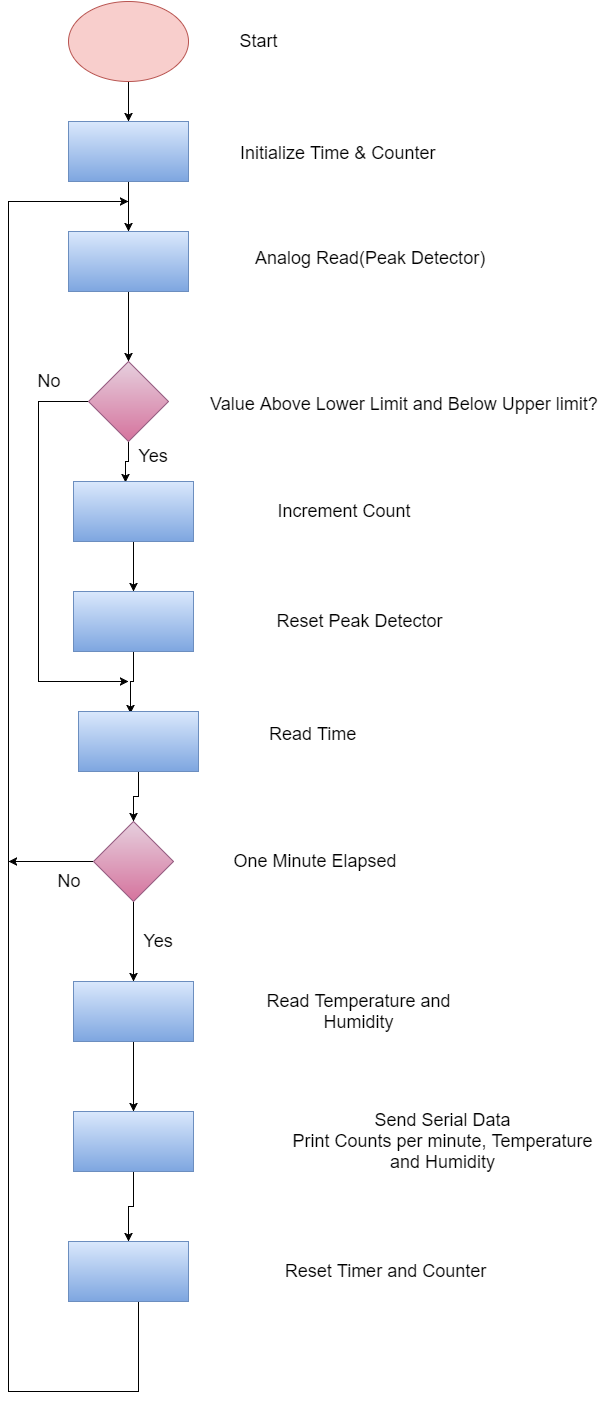
Arduino Programming: Process Flow
The Arduino reads the Analog signal from the peak detector using Analog pin. It also reads a temperature and humidity on a digital pin from the sensor. An open source public Arduino library for reading temperature and humidity sensors is used. The library supports DHT11 and DHT22, AM2302, RHT03 sensors. It Auto detects the sensor model. The Arduino process the voltage counts per minute, Temperature and Humidity and sends the data on a serial port and the data is displayed on a Lab view graphical interface. A reset signals is sent after each successful count or for a voltage that is higher than the maximum threshold. This process flow is mentioned in the Figure below.
The visual connection diagram for the implemented circuit is mentioned below.
Arduino Programming: Flow Chart
Arduino Implementation Flowchart is shown below.
Test cirucit image is shown below.
The design of the interface has been done by specifying the desired characteristics, i.e., the interface must be very visual, easy to use and intuitive. It is intended that the configuration and the presented data can be visualized and understood by different users without requiring a high effort.
Labview is the best tool for this project, due to its potential for the realization of short-term projects.
LabVIEW Block diagram Design
Labview General Block Diagram is shown below.
The Labview Interface Control Panel is shown below.
Lab view Interface Display Panel is shown below.
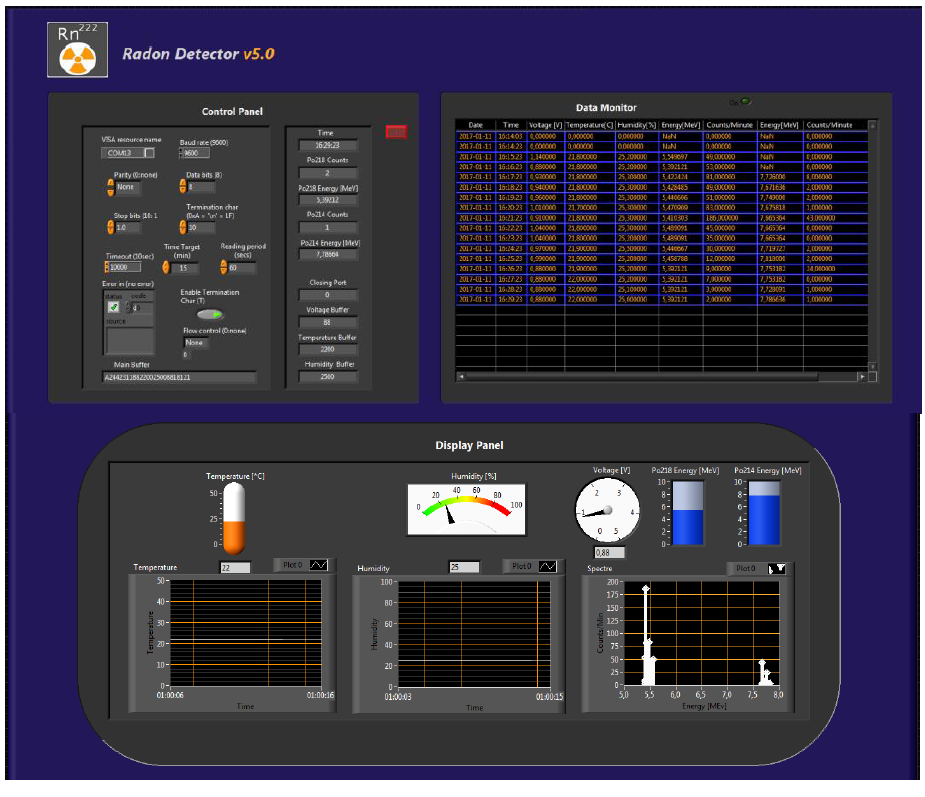
Final Labview interface design is mentioned below.
Interface Output
After the previous histograms of the counts per voltage, we can find out which are the new voltage limits. So, we start with a threshold of 0.87V to 1.2V. This is the Voltage in which we expect to get from an alpha particle of Americium at 5.486 MeV. We start our setup again and we let it log the counts according to the voltage values. The result can be seen in the following pictures. Interface Output with test circuit is shown below.
Results and commentaries
About the amplifier:
Due to the low noise nature of the project, a strip board is not the most suitable board to make a circuit upon. The design of a professional-type board in a CAD program would be the best solution for our situation. A solution like that is also preferable due to the fact that design mistakes and routing mistakes are less likely to happen, although they cannot be eliminated. The only disadvantage is the steep learning curve of one of the various PCB design software and the time and money needed to get a prototype from a professional manufacturer.
About Arduino:
The Arduino provides a good prototyping platform as it simplifies the hardware and software development to complete a specific task. Most of the libraries are publically available to use and the programming the microcontroller is easy. It is cross platform, inexpensive and provides extensible hardware and software platform. So, Arduino is the most suitalbe platform for this case.
About LAbVIEW:
LabVIEW is not the best software to perform big projects, because:
1. It is not robust enough
2. Exist delays that makes it slow
3. The license is expensive
Despite of the disadvantages, this software offers the best ratio quality/time, this makes it perfect for rapid prototyping. Because:
1. It is possible to make rapid modifications
2. It is possible to see how the results will be in a short time
3. LabVIEW offers thousands of options so you can do the most of the things that pass through your mind.









Comments
Please log in or sign up to comment.