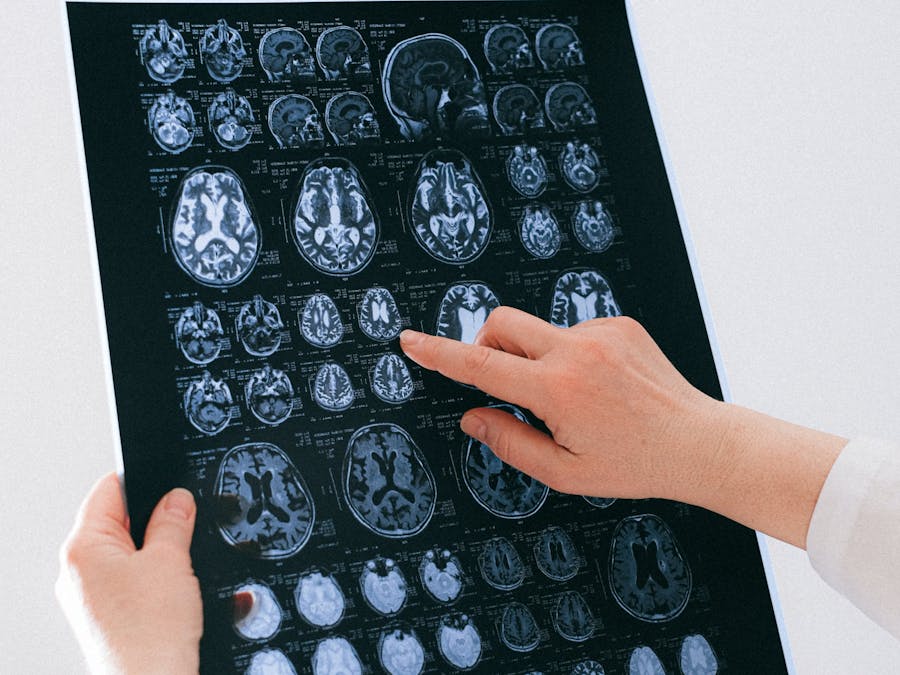
Brain-computer interface (BCI) has been one of the most interesting biomedical engineering research fields for decades. It provides a promising technology allowing humans to control external devices by modulating their brain waves. BCI involving noninvasive brain signal processing is of interest to us and also is practical to implement in real-world scenarios. There are plenty of successful EEG-based BCI applications such as word speller programs and wheelchair controllers.
Automatic emotion recognition is one of the most challenging tasks. To detect emotion from nonstationary EEG signals requires a sophisticated learning algorithm that can represent high-level abstraction.
What is an Emotion ?Emotions are biological states associated with the nervous system brought on by neurophysiological changes variously associated with thoughts, feelings, behavioural responses, and a degree of pleasure or displeasure. There is currently no scientific consensus on a definition.Some say, they are states of feeling that result in physical and psychological changes that influence our behavior. Others state that emotions are not causal forces but simply syndromes of components, which might include motivation, feeling, behavior, and physiological changes, but no one of these components is the emotion. Nor is the emotion an entity that causes these components.One thing we can all agree is that emotions are complex.
A model of emotion can be characterized by two main dimensions called valence and arousal. The valence is the degree of attraction or aversion that an individual feels toward a specific object or event. It ranges from negative to positive. The arousal is a physiological and psychological state of being awake or reactive to stimuli, ranging from passive to active.
Electroencephalogram (EEG) is a record of the oscillation of brain electric potentials resulting from ionic current flow between brain neurons. EEG signals are acquired by measuring the electrical activities at electrode’s positions on the scalp. Human’s brain wave is the composition of five main frequency bands called delta (1–3 Hz), theta (4–7 Hz), alpha (8–13 Hz), beta (14–30 Hz), and gamma (31–50 Hz).
The most widely used method to analyze EEG data is to decompose the signal into functionally distinct frequency bands. This implies the decomposition of the EEG signal into frequency components, which is commonly achieved through Fourier transforms. The almost invariably used algorithm to compute the Fourier transform (and arguably the most important signal processing algorithm) is the Fast Fourier Transform (FFT), which returns, for each frequency bin, a complex number from which one can then easily extract the amplitude and phase of the signal at that specific frequency. In spectral analysis, it is then common to take the magnitude-squared of the FFT to obtain an estimate of the power spectral density (or power spectrum, or periodogram), expressed in (micro)-Volts2 per Hertz in the case of EEG data.
Identifying Relative Band Power
We are going to see how to compute the Relative power of a signal in a specific frequency range, using Welch methods in python. The code is attached below. I will show you what the the various power levels of above EEG is.
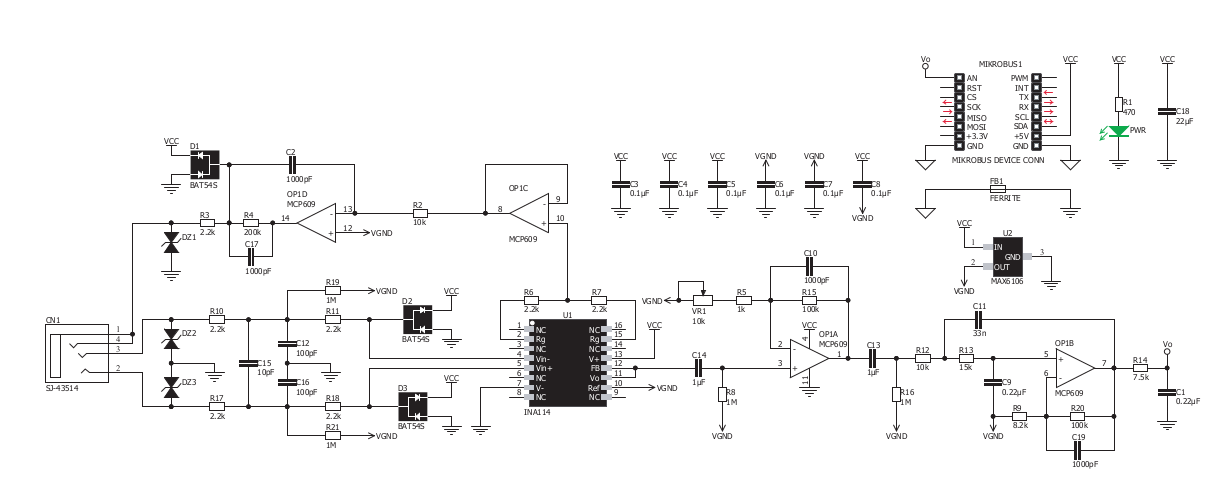
Now as we have successfully calculated the relative band power of a person's EEG lets try to make a machine learning model to predict the emotion with this. Since I couldn't get the MicroE EEG click board on time I relied on prerecorded Data set for training my model.
Vitis-AI 1.1, provided by Xilinx, provides a development flow for AI inference on Xilinx devices. This flow includes an AI engine, called the DPU (Deep-Learning Processing Unit), along with an API for Linux applications, called VART. To get started, the general format of a Python example, making use of the VART API.


Comments