
Source code is available in here - https://github.com/nanomesher/PiMonitor
IntroductionWe have a stack of Raspberry Pi's which we are using as web servers running python, gunicorn, sqlite databases as well as MQTT broker. We would like to have a device where we can monitor the health (free memory and temperature) of these Raspberry Pi. Rather than sparing a monitor for this, we decide to build a simple monitoring solution using the Nanomesher HMI. It will also light up the onboard LED as warning if low in memory or disk space.
Nanomesher HMI is a WiFi touch screen display developed by Nanomesher with an easy-to-use HTTP and MQTT based API. In this project, the Raspberry Pi's will update the Nanomesher HMI via the HTTP API.
ArchitectureThe architecture is very simple. Each of the Raspberry Pi runs a python script which regularly fetches health information (CPU utilisation, CPU temperature, Free memory and Free Disk space) and updates the Nanomesher HMI via http.
Display - Nanomesher HMINanomesher HMI is a simple-to-use wireless display with touch screen which combines a Nextion touch screen display and a Wemos D1 mini. Nanomesher provides an open source API which gives easy access to display functionalities such as setting values and colours on the display as well as beeping and blinking on the onboard speakers and LED.
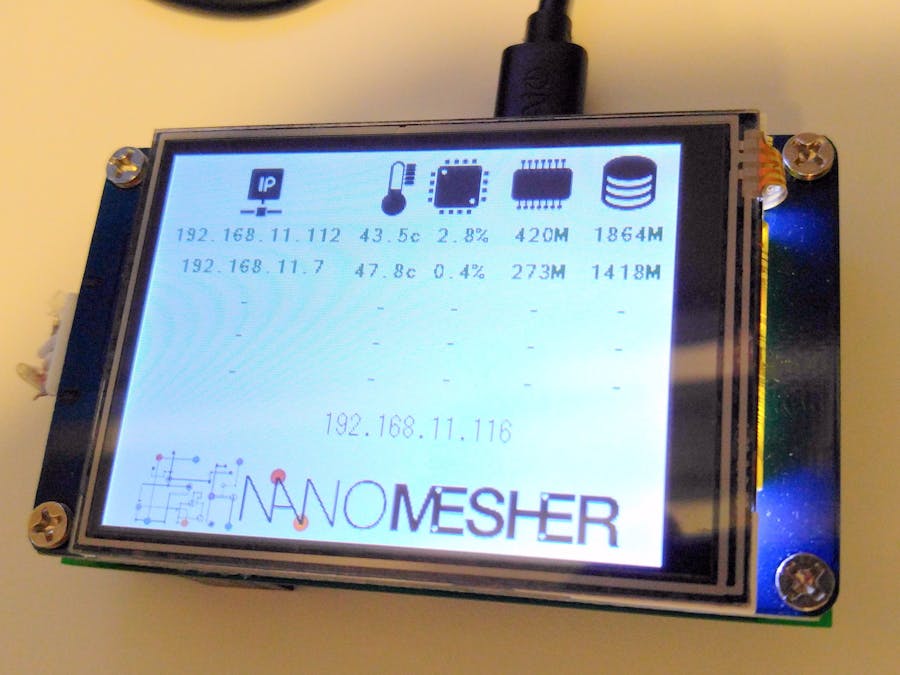
We used the Nextion designer to draw 5 rows of text boxes on the screen. Each Pi will update one row on the display and the information will rotate. The number of rows can be fitted depend on the font and how compact the screen is designed. “iplbl” is used to display the ip address of the screen.
The easiest way to fetch CPU temperature is with the below command.
/opt/vc/bin/vcgencmd measure_temp
Python provides open command to run linux command and return results. A few string replace has been added to format the output to what we need
def GetTemp():
    cmd = "/opt/vc/bin/vcgencmd measure_temp | sed -s 's/=/:/g'"
    p = Popen(cmd, shell=True, stdout=PIPE)
    output = p.communicate()[0]
    return output.replace('\n','').replace('temp:','Temp:').replace("'C","c")
This is quite easy with the native platform independent psutil python library.
To install:
sudo pip install psutil
Or if using python3:
sudo pip3 install psutil
We are interested in displaying CPU utilization , free memory and disk space
The virtual_memory() function return values in bytes. Therefore we need to divide by 1024 twice to get the megabytes value.
def GetFreeMem():
    return str(psutil.virtual_memory().free/1024/1024) + "M"
CPU and Free Disk spaces are quite straight forward
def GetCpuPercent():
    return str(psutil.cpu_percent()) + "%"
def GetFreeDisk():
   return str(psutil.disk_usage('/home/pi').free/1024/1024) + "M"
Note that there is also a cpu_times_percent() if individual cpu % is needed.
Lastly, the IP address is shown by fetching either from eth0 or wlan0 interface.
def GetLANIP():
  cmd = "ip addr show eth0 | grep inet  | grep -v inet6 | awk '{print $2}' | cut -d '/' -f 1"
  p = Popen(cmd, shell=True, stdout=PIPE)
  output = p.communicate()[0]
  return output

def GetWLANIP():
  cmd = "ip addr show wlan0 | grep inet  | grep -v inet6 | awk '{print $2}' | cut -d '/' -f 1"
  p = Popen(cmd, shell=True, stdout=PIPE)
  output = p.communicate()[0]
  return output
Nanomesher HMI is very easy to integrate with it’s HTTP-based API. Below uses simple HTTP get request to set values and colour on the display.
- ‘p’ - page number
- ‘n’ - name of the UI component
- ‘v’ - text to set
- ‘fc’ - foreground colour (uses 16bit colour code)
def PublishToDisplay(text,label_prefix):
   try:
     data = {}
     data['p'] = '0'
     data['n'] = label_prefix + sys.argv[2]
     data['v'] = text
     data['fc'] = '23555'
     url_values = urllib.urlencode(data)
     url = "http://" + sys.argv[1] + "/TextSetText?" + url_values
     response = urllib2.urlopen(url)
     html = response.read()
   except:
     pass
Data[‘n’] indicates the component name which is passed in as command line argument. The number of rows depends on how you design the layout of the screen. In this example there are 4 rows named, line1 , line2, line3 and line4 respectively.
WarningsWe thought it would be useful to give visual indications of Pi health problems such as low memory or disk space and hence we have added such checks below to show the information in red and light up the LED.
   freemem = GetFreeMem()
   if(freemem > 100):
      PublishToDisplay(str(freemem) + "M","mem","23555")
      LedOff()
   else:
      PublishToDisplay(str(freemem) + "M","mem","61455")
      LedOn()
   freedisk = GetFreeDisk()
   if(freedisk > 500):
      PublishToDisplay(str(freedisk) + "M","disk","23555")
      LedOff()
   else:
      PublishToDisplay(str(freedisk) + "M","disk","61455")
      LedOn()
   if(freemem > 100 and freedisk > 500):
      LedOff()
   else:
      LedOn()
Download PiMonitor.py from github. Install pip, if you haven’t:
sudo apt-get install python-pip
Install psutil:
sudo pip install psutil
Or if using python3:
sudo pip3 install psutil
Run by using:
python PiMonitor.py 192.168.11.116 1
Where:
192.168.11.116 is the IP address of Nanomesher HMI (displayed on the screen). 1 indicates which row in the display to update, so different Pi would update different rows (1 - 4).
Final WordsWe hope that you like this project and leave us a message or visit our website if you have any questions!
Comments