

Hardware components | ||||||
 |
| × | 2 | |||
 |
| × | 3 | |||
 |
| × | 1 | |||
 |
| × | 1 | |||
 |
| × | 1 | |||
 |
| × | 1 | |||
 |
| × | 1 | |||
Software apps and online services | ||||||
 |
| |||||
| ||||||
| ||||||
 |
| |||||
| ||||||
Hand tools and fabrication machines | ||||||
 |
| |||||
 |
| |||||
 |
| |||||
 |
| |||||
 |
| |||||
 |
| |||||
According to Greenpeace, Europe’s honey bee population has fallen by 25% in just 20 years. This decline translates into an increase in winter mortality, which can reach and exceed about 30% in some regions of France. Intensive use of pesticides and significant destruction of bee housing areas also pose a threat to this species. The collapse of the colonies is brutal and concerns both amateur beekeepers and professional beekeepers. This is a concern because environmental and economic issues are important. Human beings would be directly affected by the disappearance of bees. We are very dependent on bees for our food, for the pollination of wildlife.
As part of our training at Polytech Sorbonne, we have been entrusted with a project to build a connected hive to help the beekeepers monitor the state of the hive and its environment thanks to the information provided in real time by the sensors installed on the hive.
Our system must be able to send certain characteristic data, such as the internal and external temperatures of the hive, the internal and external humidity as well as the weight of it, to the beekeeper via several sensors and a cloud server. The prototype we created is autonomous and recharges thanks to a solar panel and a battery connected to it.
This article describes the overall functioning process of the connected hive set up during a project conducted during our fourth year in the EI-2I training at Polytech Sorbonne.
FeaturesFor the information sent to the farmer to be consistent with the bee environment we need to collect:
• Hive weight (Amplifier HX711)
• Internal and external hive temperature (DHT 22 humidity sensor and DS18B20 temperature sensor)
• Internal and external humidity of the hive (DHT22 sensor)
Prerequisites for developers• Knowledge of microcontroller programming (Arduino)
• Know how to read a data sheet and extract the relevant data
• Know how to use software such as Sigfox (receiving and sending data), Ubidots (viewing data), Altium (to create the PCB)
How does it work ?The main idea of the hive is the following, we find in pale pink, the main actions of our sensors, in green the materials used, in white the actions and data to be analyzed by the beekeeper :
We can have a more detailed diagram which explains the system :
And here we have a schematic which shows the connexions between the components
For this project, we used two DHT22 sensors, three DS18B20 sensors, an HX711 amplifier made up of a strain gauge. After a comparison among various sensors, our team retained these components for their accuracy and measurement ranges. They are faithful to the climatic conditions of the Paris region and to the conditions within the hive.
The DS18B20 sensors will be positioned in the hive to measure internal temperatures at various locations within the hive. We will also place a DHT22 sensor inside the hive to observe the internal humidity of the hive, the second DHT22 sensor will be used to measure the external temperature and humidity. All of these measures allow us to monitor the environmental conditions of bees both inside and outside the hive. The weight will also be raised to better understand the situation of the hive and the bees.
All this information collected by the sensors will then be transmitted by the SigFox antenna at an interval of 12 minutes. A dashboard on Ubidots will allow us to monitor the evolution of the environment.
Implementation of the modelThis system will be mounted on an Arduino MKRFOX 1200 board which will then be placed in the case. We also thought about a power system that will allow our case to operate in autonomy. A LIPO battery will be connected to the Arduino board, and a solar panel. The percentage of battery charge will also be monitored. To reduce the consumption during the waiting period between each sending of information by the board with SigFox, we will put the Arduino board into sleep mode. This will reduce its energy consumption. In addition, we will also put the HX711 amplifier in sleep mode between each measurement. To do this, after each measurement we put the observation of the weight sensor in sleep mode, and we will wake it before each measurement. The time measurement will be done by the sleep time of the Arduino board. This allows us to save more than 20 mA over a 12-minute time between each data send.
Once our LabDec tests were successful, we moved on to the creation of the PCB (Printed Circuit Board).
To begin, we used the Altium software, an integrated computer-aided design software chain for electronic systems. First of all, we modeled the diagram as in the image below.
To import the MKRFOX board, we installed the Loader V2.2 library and the 110990030 library for the sensors. We linked the components with labels to make the diagram readable.
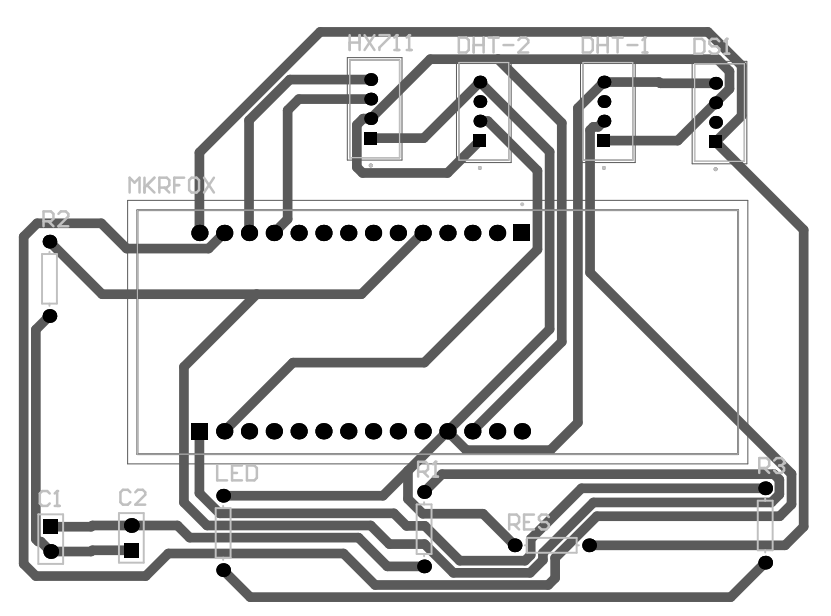
As you can see with the picture below, we have exported our schematic to PCB. Here are the steps we did:
- Define the outline of the board so that the printer targets a particular area
- Define the width of the components (min width: 16 millimeters, max width: 39 millimeters)
- Choose the layer to be used for wiring and soldering (here we chose the bottom layer)
- Define the ground plane
- Route the board (the wires must not cross each other)
The Sigfox network specializes in the Machine to Machine via energy-efficient low-flow networks which promotes the autonomy of our hive. It contributes to the Internet of Things by allowing interconnection via an LPWAN gateway.
To set up the Sigfox module:
• You must register your device with the Sigfox back end. Go to https://backend.sigfox.com/activate and you will find a list of Sigfox compatible development kits, choose your kit to continue.
• Next, you will need to choose a Sigfox operator for the country in which you are going to activate your device. Find your country and select the operator to continue.
• Once your device is saved in the Sigfox backend, you should see it in the Device section as shown in the image below:
This technology allows us to send 140 messages per day over a maximum of 12 bytes so we have adapted our codes with these conditions, so we send sensor data every 12 min over 12 bytes. This data can be accessed on the Sigfox Backend.
To interact with the IoT data analysis and visualization platform that is Ubidots, you just need to configure callbacks that allow us to transmit our data from Sigfox to Ubidots.
· • To configure a callbakc to the Ubidots API, use the
· Type : Data - Uplink
· Channel : UTL • Custom payload config : value0::uint:8 value1::uint:8 value2::uint:8 value3::uint:8 value4::uint:8 • URL pattern: https://industrial.api.ubidots.com/api/v1.6/devices/{device}/
· Using the HTTP method: POST
· Send SNI : Checked
· Headers : x-auth-token BBFF-SSwnDYhu1rEvidVo5vDVpgpMvam4Ky
· Content Type : application/json • Body: { "Temperature" : {"value":"{customData#value0}"}, "Humidity" : {"value":"{customData#value1}"}, "TempIntern" : {"value":"{customData#value2}"}, "Anemo" : {"value":"{customData#value3}"}, "Poids" : {"value":"{customData#value4}"} }
Once your device is ready, go to your Ubidots account to view the new device created with the variables. In the Ubidots account, create a new currency in the Devices menu. Afterwards, you can view the different variables by clicking on them. On the temperature, because we had multiplied it by 10:
To have it in degree, we divide our first temperature variable by 10:
Then we create our Dashboard, in a more aesthetic way so that the beekeeper can easily read the data of the hive and interpret it in real time. To send the notifications to the farmer we went through Ubidots, we clicked on the data, then on Events:
Then, click on Create Event:
And we set our e-mails.
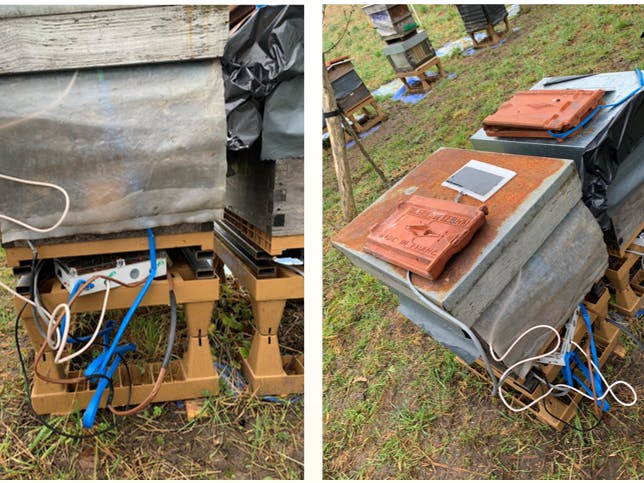
Initially, the cables were twisted and sealed by covering them with plastic sheaths. Then our team weld all the components to the board. After checking the correct operation of the assembly. We drilled the box to pass the cables, in addition, we added a fabric to protect the internal moisture sensor from honey and beeswax.
Once the box was hermetically sealed, we proceeded to install the box on the hive. We also put in place a button to turn on and off the case, an led tells us the ignition and sends the data while flashing.
ConclusionThis project allowed our group to work on producing a marketable product from start to finish. We wrote the Arduino code, built the PCB board, welded the components, prepared the sensors and the case. This allowed us to improve our technical skills and our ingenuity in order to carry out this project. We gained a lot of experience and improved our management skills, and programming skills.


_3u05Tpwasz.png?auto=compress%2Cformat&w=40&h=40&fit=fillmax&bg=fff&dpr=2)
Comments
Please log in or sign up to comment.