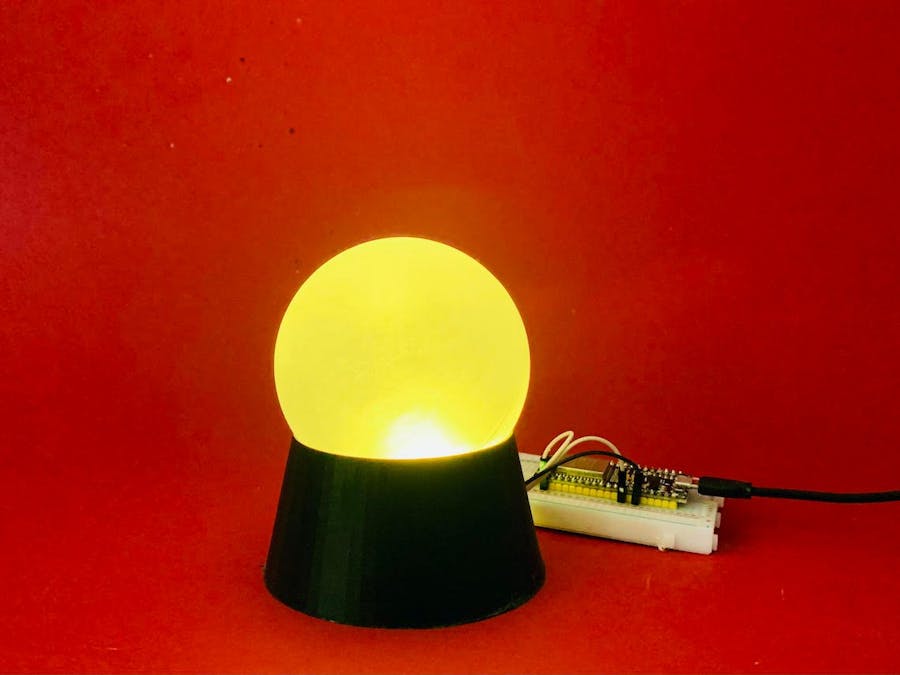
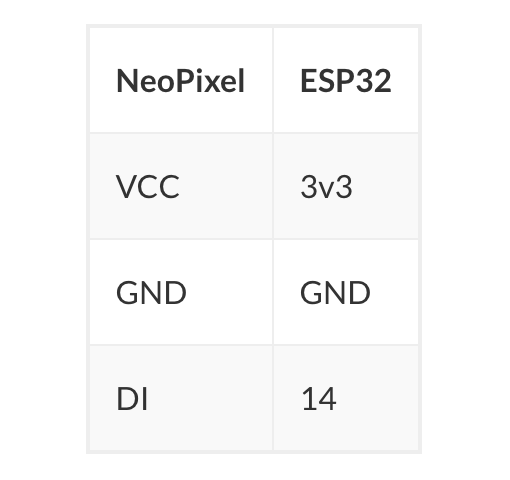
In this project, you use an ESP32 to download current headlines from the Internet and use a sentiment analysis to find out whether they are positive or negative. A NeoPixel LED ring then shows you whether the news situation is good (green), bad (red) or something in between.
We assume that you are familiar with some basics and already know how to program an ESP32 with the Arduino IDE and connect it to the internet. You should also be familiar with the ArduinoJson library and know how to use a NeoPixel LED ring.
Here we focus on the two APIs of Newsapi and Meaningcloud and describe how you download the latest headlines and evaluate them with a sentiment analysis.
Download the latest headlinesFirst create a free account on newsapi.org to get your API key which you need to query the messages.
Afterwards you can retrieve e.g. country-specific Top Headlines, which will be provided to you as JSON. You can also filter the news by country, keywords and sources.
The URL for the API Call is then as follows - where you have to replace <<API-KEY>> with your own API Key.
http://newsapi.org/v2/top-headlines?country=us&apiKey=<<API-KEY>>With this query, your ESP32 receives data in JSON format, which it can process using the ArduinoJson library and pass on to sentiment analysis.
By the way: If you want to analyze the latest news about Covid-19, use the following URL:
http://newsapi.org/v2/everything?q=covid&apiKey=<<API-KEY>>This is where another free API comes into play: meaningcloud.com - again, you will need a free developer account which will provide you with a limited (but here sufficient) number of queries. For this service you also need an API key, which you have to enter in the query URL.
This URL looks like this:
http://api.meaningcloud.com/sentiment-2.1?key=<<API-KEY>>&of=json&txt=<<TEXT>>&lang=enAs you can see, you pass the headlines from newsapi.org in the URL to the API. This is in the article variable, but with spaces between the words, which of course does not work in a URL. Therefore you replace these spaces with a %20 as follows:
article.replace(" ", "%20");Now you can flexibly assemble the URL for the sentiment analysis:
http://api.meaningcloud.com/sentiment-2.1?key=<<API-KEY>>&of=json&txt=" + article + "&lang=enIn a sketch, this happens 15 times in a for-loop - for the 15 latest headlines.
The results of the sentiment analysisNow it gets exciting: The API plays back a lot of data in JSON format, but here we are only interested in the sentiment of the headline. There are five values for this:
- Very positive: P+
- Positive: P
- Neutral: NEU
- Negative: N
- Very negative: N+
In addition, there is the value NONE - if no sentiment could be determined. To each of these values you assign a number in the sketch: from 2 for P+ to -2 for N+.
Here is an example of a very positive headline:
if (score_tag == "P+") {
  sentiment += 2;
}
Add these numbers together and you get a value - the current state of the world, or at least the news. 😉
Output the total value as color
Theoretically, the total value of the 15 headlines could range from -30 to +30. In most cases, however, a scale from -5 to +5 is sufficient.
You assign colors to these 11 values within the scale, which you create as RGB values - and then let your NeoPixel LED ring shine in the color of the total value. We have chosen a color spectrum from red to green - with yellow in the middle for the neutral value zero:
int minus5[] = {255, 0, 0};
int minus4[] = {255, 51, 0};
int minus3[] = {255, 102, 0};
int minus2[] = {255, 153, 0};
int minus1[] = {255, 204, 0};
int neutral[] = {255, 255, 0};
int plus1[] = {204, 255, 0};
int plus2[] = {153, 255, 0};
int plus3[] = {102, 255, 0};
int plus4[] = {51, 255, 0};
int plus5[] = {0, 255, 0};
If you want to determine the colors yourself, search for Color Picker on Google.
All that is missing in the sketch now is some code to output a color according to the total value of the sentiment analysis. For the value -4 for example:
switch (sentiment) {
  case -4:
    for (int i = 0; i < 12; i++) {
      pixels.setPixelColor(i, minus4[0], minus4[1], minus4[2]);
      pixels.show();
    }
    break;
All values of -5 and below (as well as +5 and above) you catch before with an if-query:
if (sentiment <= -5) {
  for (int i = 0; i < 12; i++) {
    pixels.setPixelColor(i, minus5[0], minus5[1], minus5[2]);
    pixels.show();
  }
At the very end of the sketch you add a delay that determines when the next headline query and sentiment analysis should take place - e.g. every 30 minutes:
delay(1800000);Want more? On Pollux Labs you can find many more ESP32 and ESP8266 projects.


Comments
Please log in or sign up to comment.