In many cities in underdeveloped countries programs to measure air pollution are poorly implemented or completely lacking. Being able to accumulate air pollution data with reasonable granularity would help to analyze pollution issues more accurately, measure its impact and help elaborate government policies to reduce pollutions levels. For instance, it could be very helpful to have air pollution maps around schools and hospitals in order to identify pollution sources and take necessary measures. However, having air pollution sensors scattered all over the city isn't cheap or even practical. It would much better to "crowdsource" air pollution measurement with the use of portable air quality mappers that volunteer citizens can carry with themselves on their daily routines.
The Air Quality Mapper is a system that measures air pollution and aggregates data on a cloud server for further analysis and visualization. It consist of a portable IoT device with sensors, a custom Android application and a web server.
Functional DescriptionFigure 1 shows the system block diagram. The mapping IoT device is based on Nordic Semiconductor's nRF5340 Development Kit (DK), which in turn is based on the nRF5340 System on Chip (SoC). It supports multiple wireless protocols including Bluetooth Low Energy and it has two Arm® Cortex®-M33 processors, one core is in charge of the wireless communications and the other core is used for the application.
For the mapping IoT device, three offboard sensors are connected to the nRF5340 DK to measure air pollution variables: An eCO2/eTVOC sensor, a barometric pressure sensor and an ambient temperature/relative humidity sensor. The nRF5340 reads data from the sensors and sends them via Bluetooth to the Android mobile device.
The Android application receives the sensor data from the mapping IoT device and adds to each data point a timestamp, latitude/longitude coordinates and the name/ID of the mobile device/user, before sending them to the web server. The web server receives this data and stores them in a MariaDB database. Moreover, the web server puts up a web page to visualize stored sensor data in a map, along with a 2D and a 3D graph for an accurate inspection of each data point.
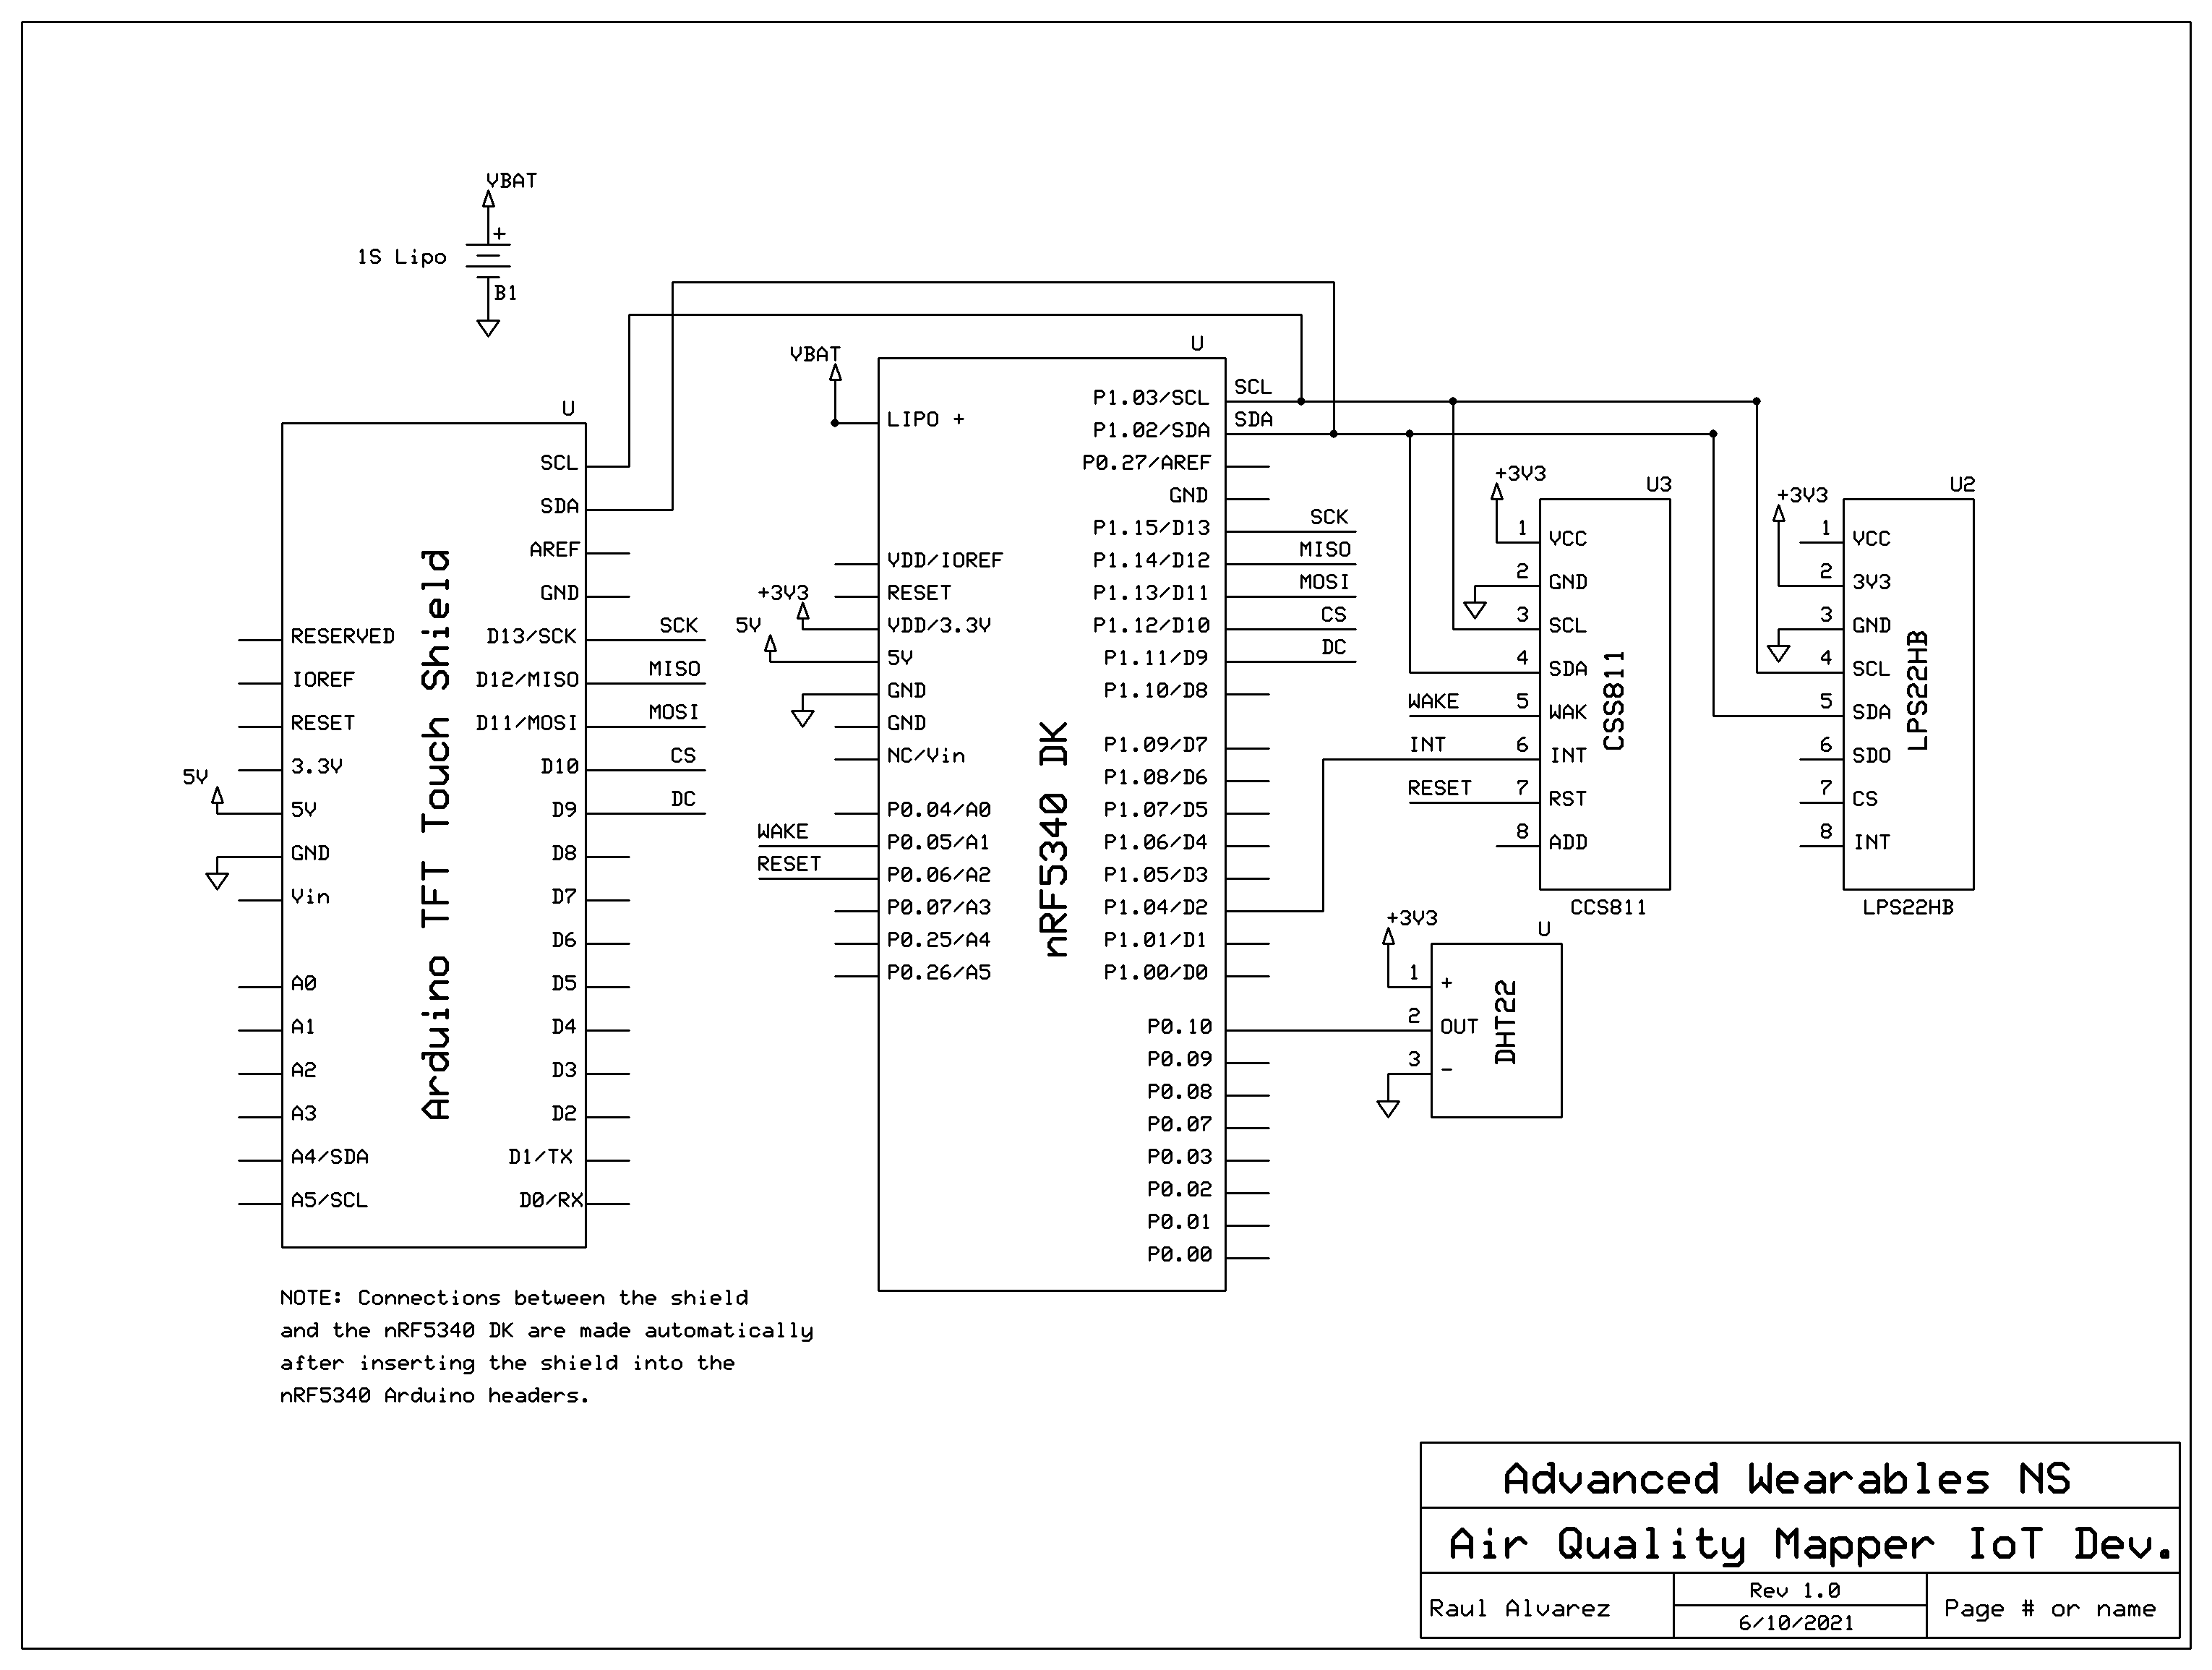
Demo VideoMapping IoT DeviceThe mapping IoT device prototype is primarily based on the nRF5340 Development Kit and includes the following offboard sensors: A CSS811 eCO2 (carbon dioxide) and eTVOC (Total Volatile Organic Compounds) sensor, a LPS22HB barometric pressure sensor and a DHT22 ambient temperature and relative humidity sensor. It also has an Adafruit 2.8" TFT Touch Shield for Arduino with Capacitive Touch connected to the Arduino-compatible socket in the nRF5340 DK board. The device is powered from a 1400 mAh, 1S Li-Po battery. Figure 2 shows the circuit diagram and Figure 3 shows a picture of the prototype.
Code for the IoT device was developed using Nordic Semiconductor's nRF Connect Software Development Kit (SDK), version 1.5.1. The core Bluetooth LE data communications is based on the 'peripheral_uart' example available in the SDK, and the the TFT display management is based on the 'ncs-display-ble-example' code example. The nRF SDK uses the "Zephyr" real-time operating system (RTOS) and it has already available I2C drivers for the three sensors used in the IoT device.
The IoT device takes sensor measurements and sends them to the Android device as JSON strings a few times a second. Figure 4 shows an example of the aforementioned JSON string. The 'key' names are shortened to 1-2 letters to minimize bandwidth: 'c' stands for eCO2, 'tv' stands for eTVOC, 't' stands for ambient temperature, 'h' for relative humidity and 'p' for barometric pressure.
The IoT device also receives data from the Android device: for instance, the GPS coordinates, motion velocity and bearing angle when the user is moving, carrying the mobile device and the IoT device on a mapping session. The GPS coordinates and velocity in m/s are displayed as text in the TFT display (see Figure 3), along with the sensors readings. The bearing angle is also displayed on the screen as a tiny digital compass. To start sending data from the IoT device to the Android device the 'Send On' button on the display must be pushed, and the same button again to stop.
Android ApplicationThe Android device, on the other hand, Sends data to the web server only after the data send has been activated in the IoT device (by pushing the 'Send On' button). It receives data readings a few times a second, but it sends the to the web server at a fixed interval of 10 seconds. On a further iteration, the application GUI will have a control to adjust the sending time interval, as well an automatic mode in which the time interval is automatically adjusted according to the velocity of motion.
The Android application is a customization of the 'Android nRF Toolbox' provided by Nordic Semiconductor, with added code for managing location and other services, as well as for HTTP communications with the web server. Figure 5 shows a screen capture of the Android application.
As it can be seen, the application GUI can also display the web page put up by the web server to visualize data points already stored in the database. This web page offer multiple types of data visualization and interaction, which will be explained in more detail later.
Web ServerThe web server application consists of the following code files:
receive_readings.php: This PHP script is in charge of receiving the sensor data from the mobile device as HTTP POST requests. Figure 6 shows the list of (key, value) pairs contained in the HTTP POST request. The last value for the "sensors" key is the JSON string with all sensor data received from the IoT device. After receiving these data, the script prepares an SQL query to save them in the MariaDB database created beforehand in the web server.
dump_readings_xml.php: This script dumps the data queried by the web browser, which in turn is used to generate all web page visualizations. It takes the query parameters received from the web page (for instance, the date range for the requested data) and, in turn, queries de database for the data.It then prepares an XML file with all data points, which is sent back to the web browser.
index.html: This is the web page html file for visualizing the data (see Figures 9a, 9b, 9c and 9d).
aq_readings.js: This is the JavaScript file embedded in the 'index.html' file in charge of generating all visualizations. It interfaces with the Google Maps API to display the sensor heatmaps.
How the web server displays all data in the web page and manages user interaction is explained with more detail in the demo video at the beginning of this presentation.


Comments
Please log in or sign up to comment.