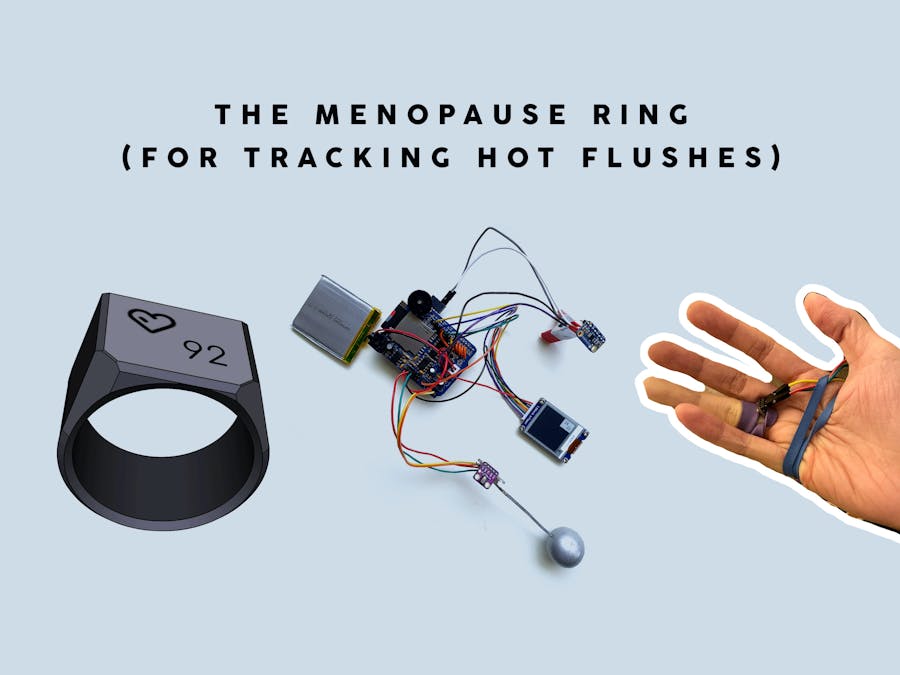
For women who want to predict and reduce hot flushes and night sweats without taking medication, there is good news! Research shows that behavioral changes like exercising, reducing stress, and simply moving to a cooler place have a significant effect on hot flush severity and occurrence. That’s where a wearable device can help: by tracking hot flushes and offering real feedback.
Heart rate and temperature are two indicators of hot flushes and night sweats. The menopause ring senses both, and with style! This ring offers a simple but powerful tool for women looking for behavioral solutions. It can help answer questions like:
- When do I experience the worst hot flushes?
- How do my hot flushes change with room temperature?
- Did exercising last week reduce the severity of my hot flushes?
Our major design goals in this project were to create a ring that is (1) easy to use, (2) visually friendly and functional, and (3) less than $50 retail.
- Easy to use: cycle through displaying your heart rate and temperature on an e-paper display with one button. To charge, place it on any Qi-compatible wireless charger and the display shows its battery level.
- Visually friendly and functional: (A) Three color choices: grey, black, white — a humble color palette, easy to match with various outfits and personal styles. (B) Form: minimalistic chamfered curves — a modern design that's easy to clean. (C) Screen display: grey, white, or black e-paper — easy on the eyes, while discreetly showing sensitive health information.
- Less than $50 retail: this ring features the most common sensors and chips available on the market in order to lower price while maintaining performance. Check out the “concept BoM” for a detailed cost breakdown.
After settling on a concept we both agreed on, we started working on the hardware prototype to validate the technology first.
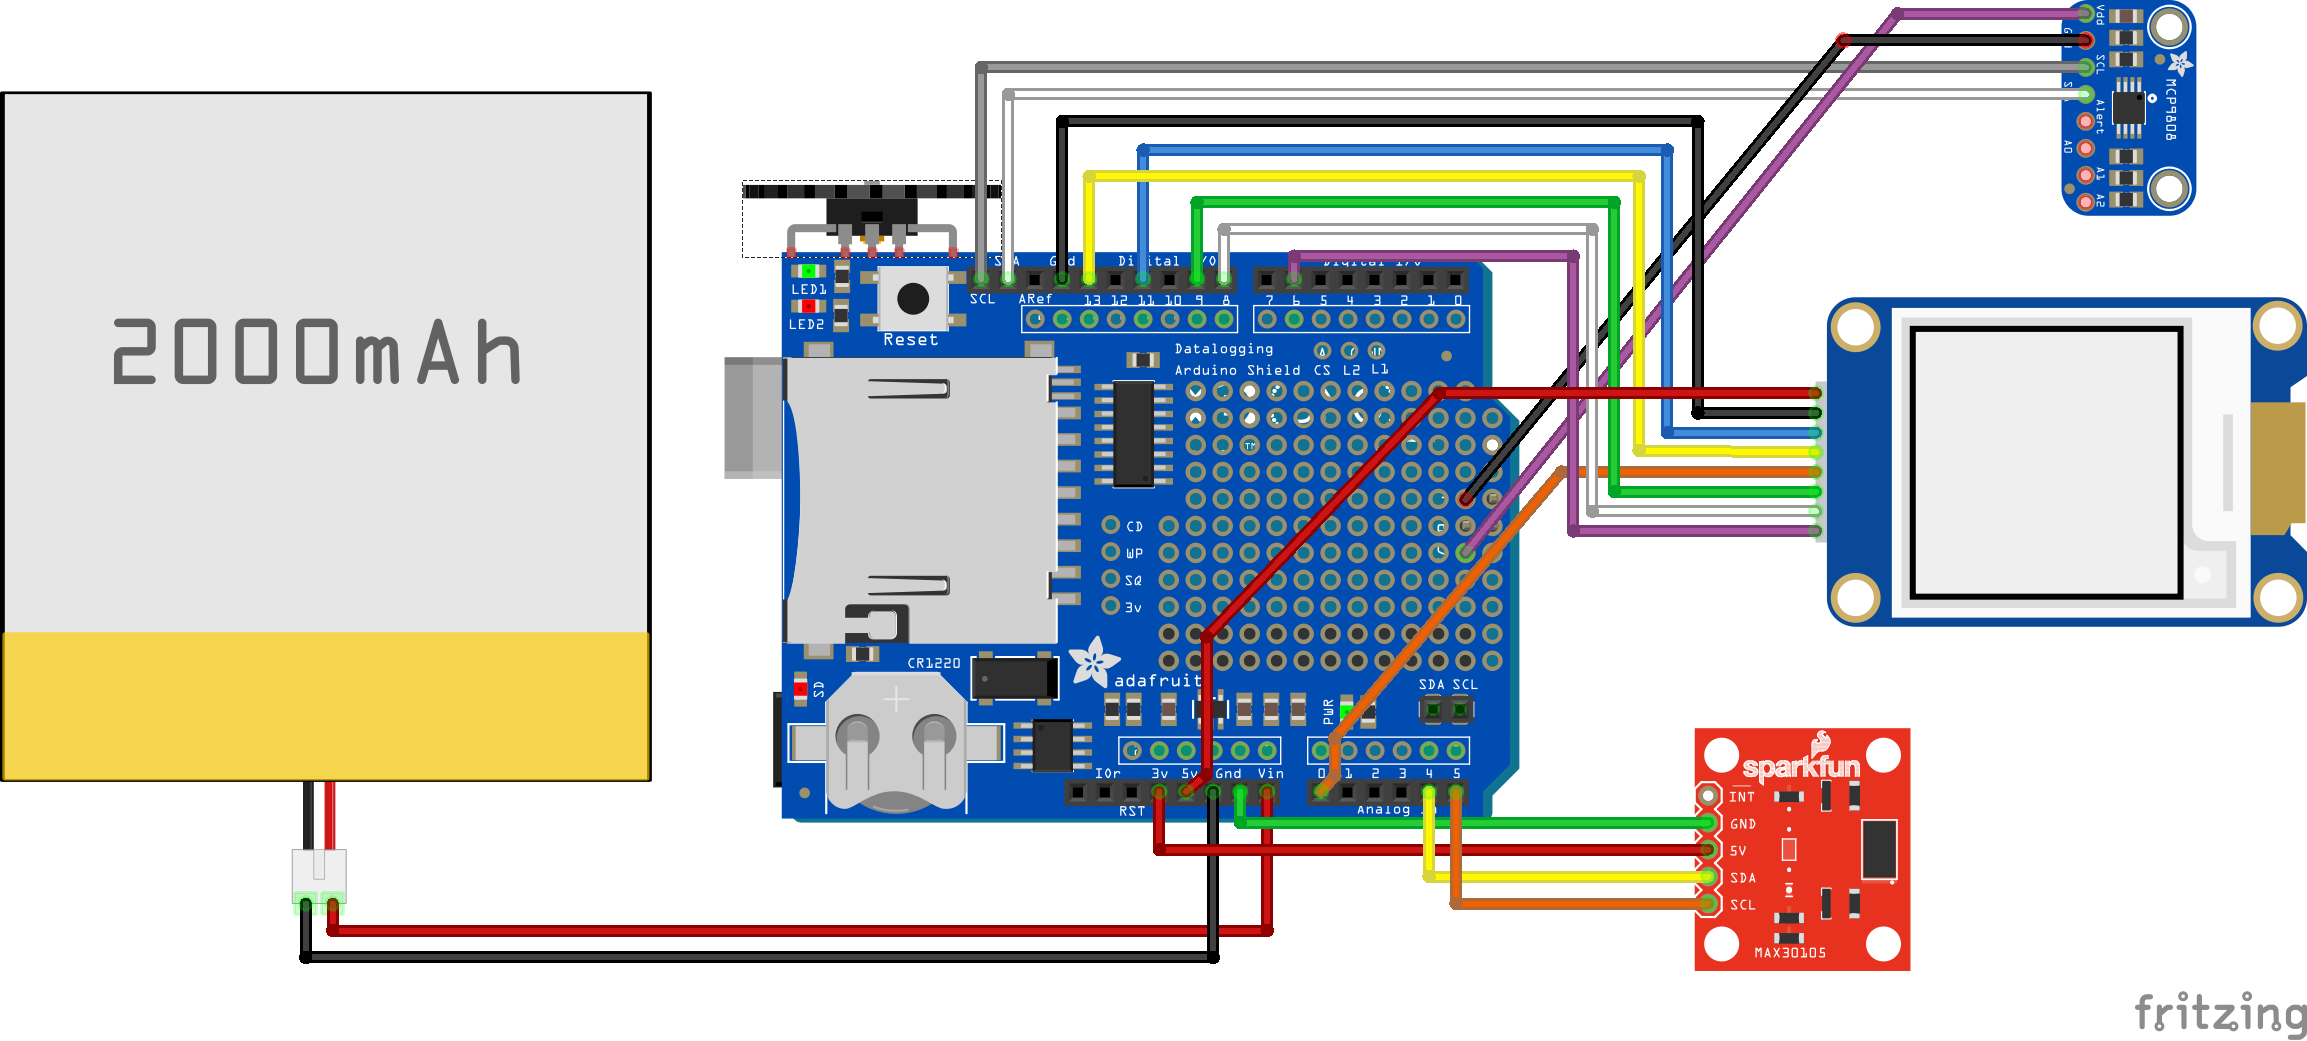
PrototypeThis prototype features all the major components of the menopause ring, with the exception of the charging coil. The Arduino Uno measures heart rate and temperature from two common breakout boards and streams it to the sd card for later analysis. It also displays the heart rate and temperature on an e-paper display every 30 seconds or so. Sure, it may be clunky, but it gets the job done (and it certainly gets attention when you walk down the street)!
Read on for more details...
Heart Rate Sensing
The MAX30102 heart rate module measures a photoplethysmogram (PPG), which is a real word and a technology used in hospitals. An LED shines into the skin and the reflected light is measured by a nearby photodiode. The amount of reflected light is modulated by the blood volume near the skin, so it jumps down when there is more blood (like during a pulse). The heart rate is then calculated by the distance between beats or by a fourier transform. Unfortunately, the blood volume also changes due to normal body movement (like squeezing the sensor or moving your arm), so there is some signal-processing needed to filter out that noise.
We used a digital filter chain to remove noise, based on an analog filter design by Geert Langereis in this paper:
- 6 Hz low-pass filter (second order)
- 60 Hz notch filter (first order) — get rid of common 60 Hz noise
- 0.8 Hz high-pass filter (first order)
- 4.8 Hz low-pass filter (first order)
- 3 Hz high-pass filter (first order) — turn the jumps in signal into local minima
We then combined the filtered signal with the likelihood of where the beat should fall based on previous measurements. We found that by multiplying the filtered signal with this likelihood, we were able to reliably capture heart beats even when the user was moving or the signal was particularly low. A diagram of that process is shown below:
And a real-time demo (the sensor is in between my fingers in this video)...
Here is an example of a shaky user for comparison...
The python script we used to plot these beats in realtime is included in the github repo under test/. We used an openGL python wrapper called Glumpy to do the heavy lifting. You can see the top line showing the filtered sensor data and predicted beats. The next two lines are the beat likelihood and combined signals, respectively. The last line is the instantaneous heart rate.
Temperature Sensing
We measure temperature using the MCP9808 sensor, which offers a resolution of 0.0625 ºC. Since hot flush events cause a skin temperature rise anywhere from 0.1 to 5 ºC (see here and here), this sensor gives us reasonable resolution to detect hot flushes at a low price ($1). The sensor is pressed slightly against the user’s finger and rises and falls with skin temperature. We measured the time constant of this sensor to be around 7 seconds, which is good enough to resolve a hot flush event because the onset takes about 1 minute.
Display
An e-paper display shows the temperature and heart rate. We chose e-paper due to its low power consumption (we calculate about 10 uA for this application). That’s because it only uses power when changing state! E-paper offers the additional benefit of looking unique for a wearable display: after considering OLED and LCD options, we chose e-paper because we thought it felt more simple and friendly in this design.
We prototyped this display on the e-paper display module from Waveshare (the smallest one we could readily find), which includes a boost converter to generate the 15 V needed to drive the display. The startup Arduino code they provided was easy enough to get up and running in a few minutes. One catch we ran into: the Arduino Uno has only 2 kbytes of RAM, so the images and font have to be stored in program memory instead.
Arduino Code
We used the Arduino Uno with an Adafruit Wave Shield we found lying around, which turned out to work splendidly as an on/off switch (the thumbwheel) and an SD card interface for data logging. Nice! We’re not sure of how easy it is to get this shield anymore, but any sd card shield should do the trick (they will all use the same SPI lines).
The following supporting libraries are used for communicating with peripherals:
- Heart Rate Sensor: SparkFun MAX3010x Pulse and Proximity Library
- Temp Sensor: Adafruit MCP9808 Library
- SD Card: PetitFS (by Bill Greiman)
- Display: e-Paper (by “Yehui from Waveshare”)
You can also find the two sensor libraries on the Arduino Library Manager.
For developing the code, we used the PlatformIO plugin for Visual Studio Code, which is cross-platform and free. If you haven’t heard of PlatformIO yet, we recommend you check it out. It is a great alternative to the Arduino IDE for larger projects.
Here’s how the main loop works:
When the user turns on the switch, the Arduino continuously polls the heart rate sensor for samples. Once enough samples fill up the “sampleWindow” where the next heartbeat is expected, the code switches to processing that beat to calculate the new heart rate. Every 40 beats (~30 seconds), the heart rate is calculated from a low-pass filter of the beat intervals (in order to avoid jumps in heart rate from, say, a common heart flutter). The display then shows the updated heart rate in beats-per-minute (bpm). Check out the github page for a simple state machine diagram.
Next Steps- 3d printed prototype / material testing: print/manufacture a ring that can hold the sensors in place without the additional movement of rubber bands.
- Wireless charging / power consumption: test an off-the-shelf Qi-compatible wireless power receiver chip with an appropriately-sized coil. Measure current draw for a system without unnecessary peripherals (e.g. a USB chip, status LEDs).
- Flex PCB: shrink the electronics down onto a single flex spanning the circumference of the ring. The concept BoM calculation shows that it should all fit, but the actual layout could tell a different story.
- Data collection: heart rate sensor accuracy varies with different ethnicities, weight, etc., so we need to test a variety of women, which means putting that SD card to use!
- Shrinking the display: e-paper looks great, but making it smaller will require working closely with manufacturers. There are also other options to consider (like electrochromic displays) which could be easier to shrink and still maintain a low power footprint.
Many thanks to Hackster.io and AARP Innovation Labs for hosting this competition. It's great to share our work with a community of creative makers online, and you make that possible!


_ztBMuBhMHo.jpg?auto=compress%2Cformat&w=48&h=48&fit=fill&bg=ffffff)


_3u05Tpwasz.png?auto=compress%2Cformat&w=40&h=40&fit=fillmax&bg=fff&dpr=2)


Comments
Please log in or sign up to comment.