


Hardware components | ||||||
 |
| × | 1 | |||
 |
| × | 1 | |||
Software apps and online services | ||||||
 |
| |||||
Temperature and humidity monitoring are part of everyday life, but in the vast majority of buildings, real-time air quality monitoring is not performed. The air quality in an area very influential on the state of the population in an area because of the quality can affect both the health of humans, animals or plants. Therefore, it is necessary to periodically monitor air quality conditions among with temperature and humidity.
Air pollution has negative effects on human health and ecosystems, as well as affecting the world’s climate. Exposure to particulate matter (PM) air pollution is one of the leading causes of morbidity and mortality globally, being responsible for between 4.2 million to 8.9 million deaths per year worldwide.
Air pollution from PM poses a significant health threat to people living in cities. The health-damaging PM, which can penetrate deep into the lungs, contributes to the risk of developing cardiovascular diseases as well as lung cancer. PM2.5 and PM10 refer to particulate matter with particle diameter up to 2.5 microns and 10 microns respectively and are among the most dangerous air pollutants.
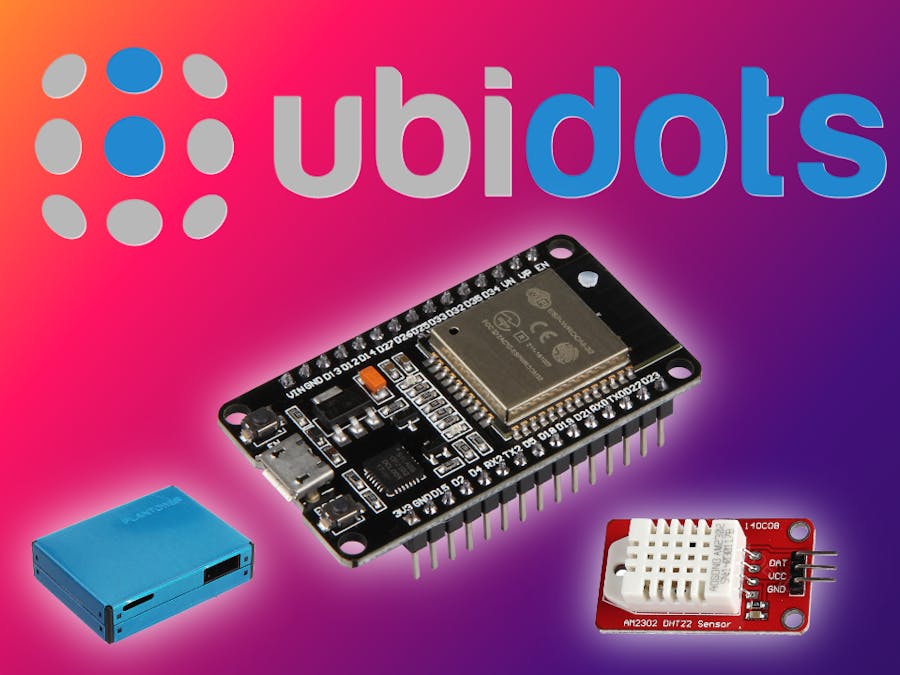
The aim of tutorialIn this DIY IoT project session, we are making a ESP32 based weather station using DHT22 and PMS7003 sensors. Where the DHT22 sensor senses the temperature and humidity, while a Plantower PMS7003 laser scattering sensor measures particulate matter.
Further, we are sending the weather station data to IoT platform for live monitoring from anywhere in the world, and we can view the logged data and graph over time on the website.
There are several IoT platform that can visualize data in real time and historical information. They are platforms that are not free while others provide a free account you can use to experiment with your project.
- Ubidots
- Temboo
- Adafruit IO
- AWS IoT
- ThingSpeak
- TheThings.io
- Xively
- myDevices Cayenne
- Kaa
We will use Ubidots platform for data visualization. It provides very good graphical representation of your data.
Ubidots is an open-source Internet of Things application and API to store and retrieve data from things using the HTTP and MQTT protocol over the Internet or via a Local Area Network. The monitoring results will be visible through a web page provided by the Ubidots cloud service.
You can use it at home, at the office, or anywhere there is an internet connection, for indoor or outdoor data logging. For the internet connection we will use the ESP32 module because it's small, cheap and easy to use, and for data logging we will use the open data platform for the Internet of Things platform - Ubidots.
The main aim of this project is to create an online weather system dashboard based on Ubidots, which enables a user to check real-time weather parameters of a place anytime and anywhere with just a few buttons click.
So, let's get started! Here's what you'll need.
Materials RequiredThe following hardware and software will be required in this tutorial:
Hardware
- PC or laptop
- ESP32 board
- DHT22 Temperature and Humidity Sensor
- Plantower's PMS 7003 Air Quality Sensor
- Double Sided Prototyping Breadboard
- Soldering kit
- Jumper Wires
Software
- Ubidotsplatform
- Arduino IDE
The ESP32 module with a built-in Wi-Fi module is used to create for monitoring air quality, temperature and humidity. The low-cost and high-performance 32-bit controller is frequently preferred in IoT applications. An ESP32 has a dual-core structure and has many internal modules such as Wi-Fi, Bluetooth, RF, IR, CAN, Ethernet module, temperature sensor, hall effect sensor and touch sensor needed for smart home applications.
The Plantower PMS7003 is a low-cost laser particle counter, one of a range of sensors by Plantower that also include the PMS1003, PMS3003, and PMS5003. PMS7003 is a kind of digital and universal particle concentration sensor, which can be used to obtain the number of suspended particles in the air, i.e. the concentration of particles, and output them in the form of digital interface. This sensor can be inserted into variable instruments related to the concentration of suspended particles in the air or other environmental improvement equipment to provide correct concentration data in time.
The most famous temperature and humidity sensors in the makers community are the DHT22 and the BME280. Each cost around $2.50.
The DHT22 is a very low-cost sensor. It's made up of two components: a capacitive humidity sensor and a thermistor, which measures temperature. Because it's a digital sensor, you can read the sensor data over a GPIO pin.
The sensor can measure temperature from -40°C to 80°C and humidity from 0% to 100% with an accuracy of ±1°C and ±1%. DHT22 is fairly simple to use, pre-calibrated and don’t require extra components.
Wiring – Connecting DHT22 and PMS7003 sensor to ESP32 boardFirst of all, connect the DHT22 with ESP32. The connections for the DHT22 with ESP32 are as follows:
- Pin 1 of DHT22 which is the VCC pin to 3.3V of ESP32
- Pin 2 of DHT22 which is the data pin to D15 of ESP32
- Pin 4 of DHT22 which is the GND pin to GND of ESP32
Then connect the Plantower PMS7003 to the ESP32. The connections are as follows:
- Vin of PMS7003 to 3.3V of ESP32
- GND of PMS7003 to GND of ESP32
- SCL of PMS7003 to pin 22 of ESP32 (Pin 22 of ESP32 is the SCL pin)
- SDA of PMS7003 to pin 21 of ESP32 (Pin 21 of ESP32 is the SDA pin)
Once you have your materials together, we can wire it up. For a more secure connection, you may want to think about soldering this to double sided prototyping breadboard, as in my case.
Here is a basic example of reading the sensor data from DHT22 and PMS7003, logging the data to the serial monitor.
Installing libraries
Communicating with DHT22 sensors is a bunch of work, as they have their own single wire protocol for data transfer. And this protocol requires precise timing. Fortunately, we don’t have to worry much about this because we are going to use the DHT library from Adafruit which takes care of almost everything. The library is so powerful that it runs on both Arduino and ESP architecture.
To install the library navigate to the Sketch > Include Library > Manage Libraries.
Then search for DHT,PubSubClient and PMS libraries and then install it.
Code and Explanation
This tutorial assumes you are using the latest version of the Arduino IDE on your desktop.
First, include libraries for Wi-Fi, Wire, DHT and PMS.
#include "PMS.h"
#include "Wire.h"
#include "SoftwareSerial.h"
#include "DHT.h"
Define some variables for dhtpin and type of DHT sensor.
#define DHTPIN 15
#define DHTTYPE DHT22
DHT dht(DHTPIN, DHTTYPE);
Define PM Sensor setup
PMS pms(Serial1);
PMS::DATA data;
In void Setup function, initialize serial monitor, DHT sensor begin() function.
void setup()
{
    Serial1.begin(PMS::BAUD_RATE, SERIAL_8N1, 5, 4);
    Serial.begin(9600);
    dht.begin();
}
In void loop function, take temperature and humidity data from DHT sensor and store in two different variables. Also, read data from the PMS sensor and print it to serial monitor.
void loop()
{
    float h = dht.readHumidity();
    float t = dht.readTemperature();
    if (isnan(h) || isnan(t)) {
        Serial.println("Failed to read from DHT sensor!");
        return;
        }
    while (Serial1.available()) { Serial1.read(); }
    pms.requestRead();
       if (pms.readUntil(data))
{
    Serial.print("PM 1.0 (ug/m3): ");
    Serial.println(data.PM_AE_UG_1_0);
    Serial.print("PM 2.5 (ug/m3): ");
    Serial.println(data.PM_AE_UG_2_5);
    Serial.print("PM 10.0 (ug/m3): ");
    Serial.println(data.PM_AE_UG_10_0);
    Serial.print("Humidity: ");
    Serial.print(h);
    Serial.print(" %\t");
    Serial.print("Temperature: ");
    Serial.print(t);
    Serial.println(" *C ");
    Serial.println();
}
}- Now, let’s connect your ESP32 board to your computer through a USB cable.
- Upload the below code.
#include "PMS.h"
#include "Wire.h"
#include "SoftwareSerial.h"
#include "DHT.h"
#define DHTPIN 15
#define DHTTYPE DHT22

DHT dht(DHTPIN, DHTTYPE);

PMS pms(Serial1);
PMS::DATA data;

void setup()
{
    Serial1.begin(PMS::BAUD_RATE, SERIAL_8N1, 5, 4);
    Serial.begin(9600);
    dht.begin();
}

void loop()
{
    float h = dht.readHumidity();
    float t = dht.readTemperature();
    if (isnan(h) || isnan(t)) {
        Serial.println("Failed to read from DHT sensor!");
        return;
        }
    while (Serial1.available()) { Serial1.read(); }
    pms.requestRead();
       if (pms.readUntil(data))
{
    Serial.print("PM 1.0 (ug/m3): ");
    Serial.println(data.PM_AE_UG_1_0);
    Serial.print("PM 2.5 (ug/m3): ");
    Serial.println(data.PM_AE_UG_2_5);
    Serial.print("PM 10.0 (ug/m3): ");
    Serial.println(data.PM_AE_UG_10_0);
    Serial.print("Humidity: ");
    Serial.print(h);
    Serial.print(" %\t");
    Serial.print("Temperature: ");
    Serial.print(t);
    Serial.println(" *C ");
    Serial.println();
}
}
After uploading program into your ESP32 board, open serial monitor with 9600 baud rate and see the output. You'll see data printed out once a second, with all the measurements. If you hold up a smoking soldering iron or something else that creates a lot of dust, you'll see much higher numbers. Note that the numbers are very precise looking but we don't believe that they're going to be perfectly accurate, calibration may be necessary!
When just logging to the serial monitor, our data isn't that useful. Once in Ubidots, we can graph and react to the data.
Ubidots Open-source IoT PlatformUbidotsis a open source IoT platform and I specially choosed it because,
- Ubidots Support MQTT protocol and it has MQTT broker service inbuilt.
- Creating Dashboards and managing devices are much more streamlined. It has almost all types of charts supported.
- Its Free and you can get it and install in your own service free of charge.
Ubidots allows you to aggregate, visualize, and analyze live data in the cloud. Ubidots supports both the HTTP and MQTT protocols as a way to ingest data into the system. We will need to use the API_TOKEN as well as our device and variable that we have created to push data into the system.
Before moving in to the IoT Cloud Service platform, Its beneficial to know about the protocol we are going to communicate with the Ubidots Cloud.
MQTT (Message Queuing Telemetry Transport) Protocol
In a nutshell, MQTT consist of three parts: Broker, Subscribers and Publishers. Broker is a server and this is where we are using a local server or a cloud implemented service. Broker manages the in and out data flow from both publishers and subscribers. Publishers are publishing some data along with a topic and subscribers are subscribing to topic(s). Subscribers only get data where they are subscribed.
Configuring The IoT Cloud Service Platform - UbidotsNow let’s move on to the interesting stuff!
Step 1: Register to Ubidots
First of all, go to the following link and sign up to Ubidots. If you already have an account, then sign in. Signing up is free and provides you with the Education plan, which is sufficient to get started on small projects or proof-of-concept applications.
Here you need to create an account.
After successfully signing up, you will head to the Ubidots home page where you can see Welcome message.
The Ubidots dashboard allows you to create dashboards where you can add graphical widgets to visualize your sensor data from various devices.
Step 2: Obtaining the Ubidots API Token
The API token is available when you click on your account name on the top right corner of the Ubidots, as shown below picture. This will be required later in the tutorial, when we use the API Token as a primary mechanism to ingest our sensor data into the Ubidots platform.
This will lead to a page where you will be shown an API key and Tokens.
Now copy the Token and make a modification in the Arduino by replacing the TOKEN you copied.
Step 3: Arduino Source Code/Program
Now, we will connect the ESP32 board with Ubidots platform by writing code for it. You can copy this code and upload it to your ESP32 Board. Change the Wifi SSID and Password before uploading the code. Also replace the TOKEN from Ubidots with your token.
#include <WiFi.h>
#include <PubSubClient.h>
#include "PMS.h"
#include "Wire.h"
#include "SoftwareSerial.h"
#include "DHT.h"

#define DHTPIN 15
#define DHTTYPE DHT22
DHT dht(DHTPIN, DHTTYPE);

PMS pms(Serial1);
PMS::DATA data;

#define WIFISSID "*************" // Put your WifiSSID here
#define PASSWORD "**********" // Put your wifi password here
#define TOKEN "********************************" // Put your Ubidots' TOKEN
#define MQTT_CLIENT_NAME "ESP32weather_station" // MQTT client Name, please enter your own 8-12 alphanumeric character ASCII string;
//it should be a random and unique ascii string and different from all other devices

/****************************************
* Define Constants
****************************************/
#define VARIABLE_LABEL1 "Temperature" // Assing the variable label
#define VARIABLE_LABEL2 "Humidity" // Assing the variable label
#define VARIABLE_LABEL3 "PM_1.0"
#define VARIABLE_LABEL4 "PM_2.5"
#define VARIABLE_LABEL5 "PM_10"
#define DEVICE_LABEL "esp32"
#define SENSOR 12 // Set the GPIO12 as SENSOR
char mqttBroker[]  = "industrial.api.ubidots.com";
char payload[1000];
char topic1[150];
char topic2[150];
char topic3[150];
char topic4[150];
char topic5[150];

// Space to store values to send
char str_Temp[10];
char str_humidity[10];
char str_pm1_0[10];
char str_pm2_5[10];
char str_pm10[10];

/****************************************
* Auxiliar Functions
****************************************/
WiFiClient ubidots;
PubSubClient client(ubidots);

void callback(char* topic, byte* payload, unsigned int length) {
    char p[length + 1];
    memcpy(p, payload, length);
    p[length] = NULL;
    String message(p);
    Serial.write(payload, length);
    Serial.println(topic);
}
void reconnect() {
// Loop until we're reconnected
    while (!client.connected()) {
        Serial.println("Attempting MQTT connection...");
        // Attemp to connect
            if (client.connect(MQTT_CLIENT_NAME, TOKEN, "")) {
            Serial.println("Connected");
            } else {
            Serial.print("Failed, rc=");
            Serial.print(client.state());
            Serial.println(" try again in 2 seconds");
            // Wait 2 seconds before retrying
            delay(2000);
        }
    }
}
/****************************************
* Main Functions
****************************************/
void setup() {
    Serial.begin(9600);
    Serial1.begin(PMS::BAUD_RATE, SERIAL_8N1, 5, 4);
    dht.begin();
    WiFi.begin(WIFISSID, PASSWORD);
    // Assign the pin as INPUT
    pinMode(SENSOR, INPUT);
    Serial.println();
    Serial.print("Wait for WiFi...");
    while (WiFi.status() != WL_CONNECTED) {
        Serial.print(".");
        delay(500);
}
    Serial.println("");
    Serial.println("WiFi Connected");
    Serial.println("IP address: ");
    Serial.println(WiFi.localIP());
    client.setServer(mqttBroker, 1883);
    client.setCallback(callback);
}
void loop() {
    if (!client.connected()) {
    reconnect();
}

    float h = dht.readHumidity();
    float t = dht.readTemperature();
    if (isnan(h) || isnan(t)) {
        Serial.println("Failed to read from DHT sensor!");
        return;
}
    while (Serial1.available()) { Serial1.read(); }
    pms.requestRead();
    if (pms.readUntil(data))
{
    Serial.print("PM 1.0 (ug/m3): ");
    Serial.println(data.PM_AE_UG_1_0);
    Serial.print("PM 2.5 (ug/m3): ");
    Serial.println(data.PM_AE_UG_2_5);
    Serial.print("PM 10.0 (ug/m3): ");
    Serial.println(data.PM_AE_UG_10_0);
    Serial.print("Humidity: ");
    Serial.print(h);
    Serial.print(" %\t");
    Serial.print("Temperature: ");
    Serial.print(t);
    Serial.println(" *C ");
    Serial.println();

    dtostrf(t, 4, 2, str_Temp);
    dtostrf(h, 4, 2, str_humidity);
    dtostrf(data.PM_AE_UG_1_0, 4, 2, str_pm1_0);
    dtostrf(data.PM_AE_UG_2_5, 4, 2, str_pm2_5);
    dtostrf(data.PM_AE_UG_10_0, 4, 2, str_pm10);

    sprintf(topic1, "%s%s", "/v1.6/devices/", DEVICE_LABEL);
    sprintf(payload, "%s", "");
    sprintf(payload, "{\"%s\":", VARIABLE_LABEL1);
    sprintf(payload, "%s {\"value\": %s}}", payload, str_Temp);
    Serial.println("Publishing temperature to Ubidots Cloud");
    client.publish(topic1, payload);

    sprintf(topic2, "%s%s", "/v1.6/devices/", DEVICE_LABEL);
    sprintf(payload, "%s", "");
    sprintf(payload, "{\"%s\":", VARIABLE_LABEL2);
    sprintf(payload, "%s {\"value\": %s}}", payload, str_humidity);
    Serial.println("Publishing humidity to Ubidots Cloud");
    client.publish(topic2, payload);

    sprintf(topic3, "%s%s", "/v1.6/devices/", DEVICE_LABEL);
    sprintf(payload, "%s", "");
    sprintf(payload, "{\"%s\":", VARIABLE_LABEL3);
    sprintf(payload, "%s {\"value\": %s}}", payload, str_pm1_0);
    Serial.println("Publishing PM 1.0 data to Ubidots Cloud");
    client.publish(topic3, payload);

    sprintf(topic4, "%s%s", "/v1.6/devices/", DEVICE_LABEL);
    sprintf(payload, "%s", "");
    sprintf(payload, "{\"%s\":", VARIABLE_LABEL4);
    sprintf(payload, "%s {\"value\": %s}}", payload, str_pm2_5);
    Serial.println("Publishing PM 2.5 data to Ubidots Cloud");
    client.publish(topic4, payload);

    sprintf(topic5, "%s%s", "/v1.6/devices/", DEVICE_LABEL);
    sprintf(payload, "%s", "");
    sprintf(payload, "{\"%s\":", VARIABLE_LABEL5);
    sprintf(payload, "%s {\"value\": %s}}", payload, str_pm10);
    Serial.println("Publishing PM 10.0 data to Ubidots Cloud");
    client.publish(topic5, payload);
}
    client.loop();
    delay(1000);
}
When you have completed coding, you don't need the PC connection. You can add a separate power source to your ESP32 and make it portable. Luckily my power bank was working and here below is my Portable ESP32 based weather station.
Let's move forward!
Step 4: Verification of connection
From the Ubidots Web portal, visit the Devices link at the top. By default, when you go to the Devices page, it will show that a default device has been configured. Now, its time to check the uploaded data on the Ubidots platform. As soon as your ESP 32 board is connected with the Wi-Fi, you will see connected status on Ubidots platform as shown below.
Once the code is uploaded to ESP32 Board, click on serial monitor. If the ESP32 connects to wifi, it will start sending data to Ubidots Cloud.
Now you should see the published data in your Ubidots account, inside the device called ESP32. As it can be seen, variables are successfully created. We should move to dashboards to create a widget to visualize the variables
Step 5: Creating Dashboards
With Ubidots, in a few clicks, you can visualize the sensor data. To graph the temperature and humidity data, we just need to create a dashboard. Each dashboard is made up of smaller components called widgets.
To work with the dashboards, please, make sure that your device is correctly connected to the platform, and you can read the resource values through the API explorer. This is required since the dashboard will use the automatic API discovery feature to easily configure the widgets, so the device must be connected when setting the dashboard.
Let’s setup an Ubidots’ Dashboard. To create it, go to the Dashboard section (Data > Dashboard)
Step 6: Adding New Widgets
Ubidots has a wide variety of widgets. We can visualize the data from the device in form of charts, metrics, maps, tables, indicators, and controls. Adding Widgets is straight-forward. Click on the + sign in the right side and “Add new Widget”, and select your widget.
Values can be seen in different format like chart form or Gauge meter by selecting the proper options in the dashboard.
Step 7: Visualize Your Data
This is the last step of our IoT Project, we have to visualize the data in real time.
Once the data is uploaded on Ubidots IoT Platform, visit your Account. Within 1-2 minutes you will start receiving the data from your ESP32 board. After creating widgets for all the five variables, the dashboard looks like this
Congratulations, you have gotten started with Ubidots! Our dashboard is created and we can see the data arriving on your dashboard. Feel free to experiment with what you have built.
ConclusionUbidots is a very good solution created for the Internet of things, allowing to create colorful dashboards and its API for sending data is very easy via MQTT/HTTP/TCP/UDP technically allows any device to send data without any complications.
Thank you everyone for reading this article and hope you were inspired by it. And please give your comments and feedback and of course I am more than happy to answer your questions.


Comments
Please log in or sign up to comment.