


Hardware components | ||||||
 |
| × | 1 | |||
Software apps and online services | ||||||
| ||||||
| ||||||
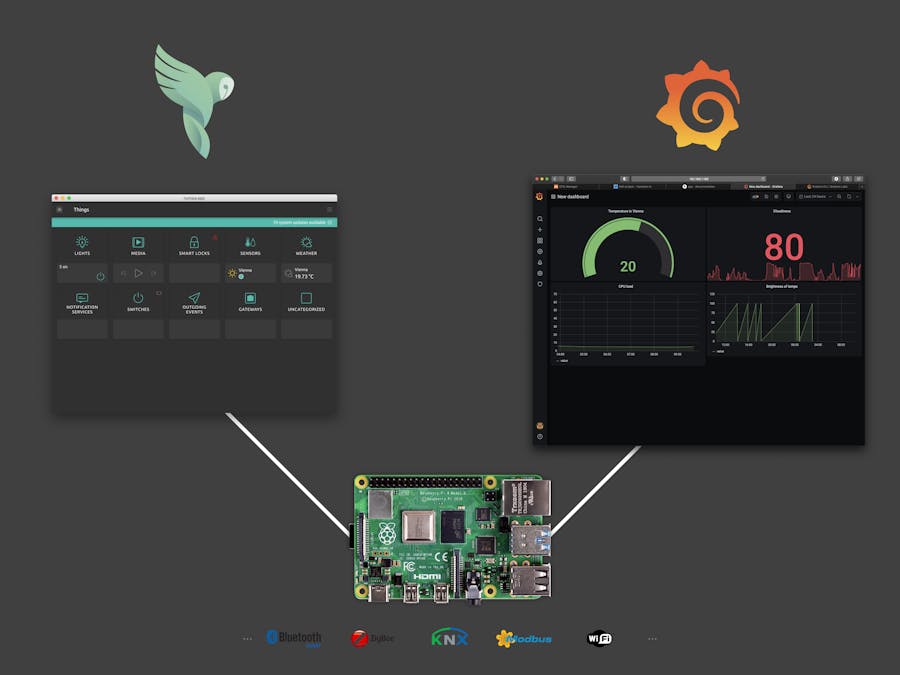
nymea:app shows some basic information about a 'things' history. However, you can't really do sophisticated data analysis with that.
Thats why you might be interested in attaching Grafana to your nymea installation. You can look back in history and find out things like
- How has my energy consumption evolved?
- How quickly drains the battery of my smart lock?
- How long were the lights on in the last month?
You can even do more complicated things, like predictive maintenance.
PrerequisitesThe starting point for this guide is a clean nymea image for Raspberry Pi (which is actually just a plain Raspbian with a modified network manager). All models are supported.
If you already installed different databases, web services or Grafana installations, they might be interfering. So I recommend to start from a plain image.
Add 'Things' to nymeaBefore you can see anything in nymea (or in Grafana), you have to add a 'Thing' to nymea.
For example you can add the openweathermap or system-monitor integration which come with the standard installation. If you're you miss your favourite integration you might want to install additional it through the App:
Menu > System Settings > System Update > Install or remove Software.
Open a terminal and SSH into your nymea installation. Both user and password is nymea.
Note: The installation guideline is just the same as on the the Grafana website.
Add the APT key used to authenticate packages:
wget -q -O - https://packages.grafana.com/gpg.key | sudo apt-key add -Add the Grafana APT repository:
echo "deb https://packages.grafana.com/oss/deb stable main" | sudo tee -a /etc/apt/sources.list.d/grafana.listInstall Grafana:
sudo apt-get update
sudo apt-get install -y grafana
nymea logs all data into a local SQLITE database. In order to make Grafana read that data we have to install the according plugin:
sudo grafana-cli plugins install frser-sqlite-datasourceGrafana is now installed, but not yet running. To make sure Grafana starts up even if the Raspberry Pi is restarted, we need to enable and start the Grafana Systemctl service.
Enable the Grafana server:
sudo systemctl enable grafana-serverStart the Grafana server:
sudo systemctl start grafana-serverGrafana is now running on the machine and is accessible from any browser: http://<ip address>:3000. If this is your only nymea installation http://nymea.local:3000 should work too.
Log in to Grafana with the default username admin,
and the default password admin.
Change the password for the admin user when asked.
Congratulations! Grafana is now running on your Raspberry Pi!
Set up GrafanaFirst, we need to connect to the local Database.
- Go to Settings an Data Sources.
- Search for SQLITE and select it.
- Give it a name as you want.
The standard Path to the database is
/var/log/nymead.sqliteThen save and exit. You successfully connected to the database.
Now you can create a Dashboard as shown:
On your Dashboard you can add one or more panels:
Toggle to text edit mode and copy-paste this SQL query:
SELECT timestamp/1000 as time, CAST(value as DOUBLE) as "Gesamtverbrauch" FROM entries WHERE typeId="{xxxxxxx-xxxx-xxxx-xxxx-xxxxxxxxxxx}";Note, that you need to divide timestamp by 1000 because nymea is using Milliseconds and Grafana uses Seconds.
Now every data point in nymea has a uniqe ID. You can find the typeId in the nymea:app (1.0.211 or higher.)
Please go to Configure Things and navigate to your desired Thing. Klick on Thing Class. This will display all available data points. Please scroll down to the section "States" and click on the data point of your choice to copy the typeId to your clipboard.
Paste the typeID into the SQL query as shown and Grafana should immediately show you the history of that data point.
You can now add more queries and panels to your Dashboard by repeating the process!
Have fun playing around with Grafana!


Comments
Please log in or sign up to comment.