


Hardware components | ||||||
_ztBMuBhMHo.jpg?auto=compress%2Cformat&w=48&h=48&fit=fill&bg=ffffff) |
| × | 1 | |||
In first article I've pointed out the fact, that LabVIEW graphical language is very useful for fast prototyping of complex systems. By that I mostly meant doing a lot of advanced analysis based on various input signals.
So far I've explained basics regarding digital write which is the easiest thing to do. Today I'll cover some more practical topic, that is analog input reading. As a sample application I've build basic temperature reader that can display value not only as a digits but also using graphical representation.
Breadboard SchematicsLet us start with designing physical circuit. For that I've used breadboard 3 wires and TMP36 analog temperature sensor.
In fact it can be any temperature sensor, but it is importunate that it will utilize analog output. Of course you can use different other protocols like I2C or OneWire, but reading there is a little bit complicated.
As you can see design is very simple. Now getting to the code.
Reading Analog ValueGood thing with development using MakerHub is the fact that the design outside main while loop is almost nothing changing at all. So again we have LINX Initialize and LINX Close with corresponding controllers. What we change is inside part.
In Block Diagram window go to MakerHub->LINX->Peripherals->Digital->Read. As you can see this block requires Analog Channel as an input. Also what's different from digital block is Al Ref output. After adding required blocks as previously you should have something like this:
Now, if you'll connect Arduino and run VI everything should be ok. But you don't see what are the readings - right? Let's fix this by adding basic number indicator.
To do that right lick on Al Value output and from menu pick Create->Indicator. This way you'll have new numeric indicator on Front Panel connected with Analog Read Al Output. Now, there are some results displayed, but they don't make any sense.
Analog Data ConversionIn typical programming language writing math formulas is very simple. In LabVIEW actually, there are two ways to "write" them. Which one you will use it's totally up to you.
The first one is use of Numeric blocks inside Programming group. Honestly I wouldn't use it here, because it will make everything to big and to much tangled I am afraid. Instead I recommend using much more advanced option - Formula Node.
To get this go to Structures->Formula Node. This block is very interesting, because it allows to write partial code inside LabVIEW. After adding this you will notice, that you cannot attach any wire to it. It is because first you need to add input.
Click right mouse button on the node and from menu select Add Input. You'll see that new rectangle has been added and it is empty inside. That's because inside you type in the name of input variable. I've picked r for reading. Now, do this same for output (I've called mine t for temperature).
If you want to convert voltage to Celsius now first you need to subtract 0.5 from read value and then multiply the result by 100. In my case I just typed in:
t = (r - 0.5) * 100;
It is very important to remember about semicolon at the end of a line. For further reference about formula node syntax please refer to official documentation.
Now only thing left is disconnecting wire between Analog Read and Numeric and pass it through Formula Node.
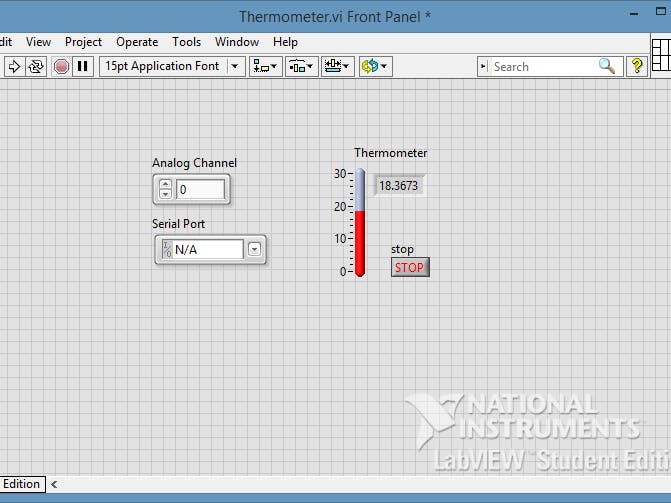
At that point you should have correct temperature displayed.
Thermometer BlockSo far we've been using rather basic controls in Front Panel design. I think reading temperature is good example of application where more advanced block can be used - thermometer.
You can find it in Front Panel under Numeric->Thermometer. Because this is numeric's group element it is also represented also as a numeric in Block Diagram. Just connect it this same way as we did in last tutorial with booleans.
Now, why I wrote that thermometer is more advanced then previous ones? Well I'd leave it to you to find out how many modifications you can do with this block and how easy it is.
Just some hints:
- To change scale (let say from 0 to 30) you only need to double click maximum value and edit it. Everything will be automatically scaled.
- Check thermometer properties window (RMB->Properties) - you'll find there thing like: slider type, data type, fill color.
- The last hint is my favorite place to look for possible modification/properties blocks. Press right mouse button and from menu go to Create->Property Node. You will find there a huge number of nodes to modify and to read value from.
In next few tutorials I'll cover other structures as well as describe more the ones already used. Since we can now read analog signal and write digital I'll use those to create some interesting applications. This way learning will be easier before moving to other protocols.


Comments
Please log in or sign up to comment.