HELLO GUYS…..
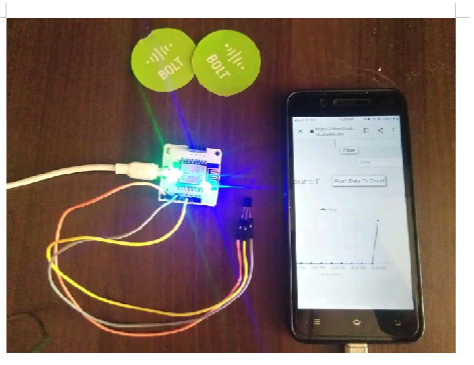
Here we are going to build something new i.e., TEMPERATURE MONITORING SYSTEM. It is very easy to understand and also to make. If you get bolt IOT kit then, it is easy to make this project.
Temperature plays an important role in our life. Agriculture, Manufacture of medicines depends on temperature. Some plants need critical temperature for their healthier growth. If we don’t maintain them at right position plants would die.
Using this project we would be able to monitor the temperature of the environment in the form of graph. So that plants can be protected.
WORKING PRINCIPLE:-The working principle is quite easy. LM35 is temperature sensor that senses the temperature of surrounding environment and generates the analog output voltage. This analog voltage produced by LM35 is given as input to bolt A0 Pin. Then bolt converts the analog value to 10 bit digital value. This digital data is send cloud throw bolt.
Temp = (analog_value100)/1023*.
To plot the graph we need to convert raw values sensor to actual temperature so, using the above formula we can convert the raw temperature values to actual temperature.
You can see the working of temperature monitoring system in the below videoRequired Components :-Wi-fi module:-
LM35 temperature sensor:-
Jumper wires (generic)
Cable:-
- Connect the adopter pin to bolt pin and give the power supply.
- Now, blue led will be on.
- Now on your mobile hotspot and connect to bolt device.
- Then green led will be on.
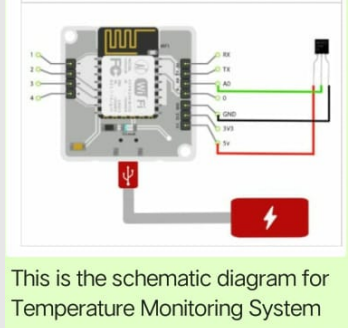
- Connect the Vcc pin of LM35 to 5volt pin of bolt Wi-Fi module.
- Connect the ground pin of LM35 to ground pin of bolt device.
- Connect the analog output pin of LM35 to A0 pin of bolt.
- Before giving the power supply make sure that your connections are tight.
- Then
- Open http://cloud.boltiot.com in your chrome.
- Now login with your mail id. In your pc.
- Now click on products at top left to connect bolt to cloud.
- If your connections are true then it will indicate online with a green dot as shown below.
- Now click on add products then write the product name.
- Now there will be two questions down.
- As LM35 is input device set the option as input device.
- As we are using GPIO pin set another option as GPIO pin.
- Now we have to make hardware connections, as we connected vcc of LM35 to 0 pin in bolt so set hardware configuration as 0 pin. Now write the product name a you wrote in last step.
- Then we have to write the code.
- Now copy and paste the below code.
- Select the graph type as JavaScript.
- Now save the code and come out. Now click on devices to configure your Project and then link your project there as shown below. Finally open the bolt app in your mobile to view the output.
- Step 3:-
Code section:-
Write the below code at your coding part. As we are using java script to write the code, so select the code type as js. Even understanding the code is very easy and important.
- setChartLibrary function:-
This function sets the data visualization Library you would use. Bolt cloud uses Google Library. We can also use HTML, Java script as we learnt them in our course.
- setChartTitle function:-
This function sets the title for your graph. This is different from name of the code.
- setChartType function:-
By this function we can choose different types of graphs. Line graph, bar graph, area graph etc.,
- setAxisName function:-
As we choose line graph, It should contain X-axis and Y-axis so by this function we can able to name the X-axis and Y-axis with time and temperature respectively.
- plotChartfunction:-
Here we can choose the variable that we want to choose in our chart.
- mul(0.0977):-
To convert raw sensor values to degrees. So we need to multiply raw sensor values with 0.0977.
Step 1:-Step 3:-Finally open the bolt Iot app as we installed previously in our mobile to see output.
Afree few counts we can observe the change in temperature as


Comments