


Hardware components | ||||||
 |
| × | 1 | |||
 |
| × | 1 | |||
Software apps and online services | ||||||
 |
| |||||
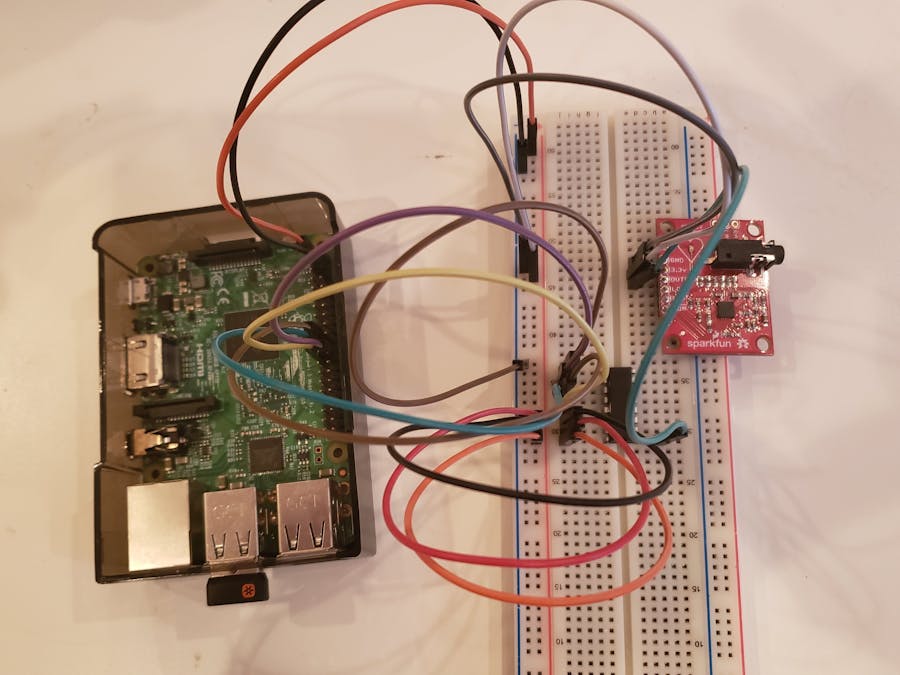
Graphing live data from analog sensors with live charts requires an ADC in this example I use an MCP3008. This example is the same as "Live Temperature Data" except with an analog sensor. You can use a wide variety of sensors (I just happened to have an AD8232) but something like a TMP36 is probably more appropriate due to the relatively low sampling rate of the ADC.
I couldn't find any class libraries for the MCP3008 but I did find a useful example on GitHub that provides the basis for reading the data. https://github.com/Microsoft/Windows-iotcore-samples/blob/develop/Samples/TempForceSensor/CS/README.md
XAML Markup
C#Add 'LiveCharts.uwp' from Nuget Package Manager and Windows IoT Extensions for Markup for the UWP' from References.
Then add this markup to the MainPage.xaml file.
Then add this markup to the MainPage.xaml file.
<Page
    x:Class="HacksterLiveChartsAnalogSensor.MainPage"
    xmlns="http://schemas.microsoft.com/winfx/2006/xaml/presentation"
    xmlns:x="http://schemas.microsoft.com/winfx/2006/xaml"
    xmlns:local="using:HacksterLiveChartsAnalogSensor"
    xmlns:d="http://schemas.microsoft.com/expression/blend/2008"
    xmlns:mc="http://schemas.openxmlformats.org/markup-compatibility/2006"
    mc:Ignorable="d"
    Background="{ThemeResource ApplicationPageBackgroundThemeBrush}"
    xmlns:lvc="using:LiveCharts.Uwp"
    >

    <Grid>
        <Grid.RowDefinitions>
            <RowDefinition Height="Auto"></RowDefinition>
            <RowDefinition Height="*"></RowDefinition>
        </Grid.RowDefinitions>
        <Button Grid.Row="0"
                Height="30"
                Click="RunDataOnClick"
                HorizontalAlignment="Stretch"
                >
            Start/Stop Data
        </Button>
        <lvc:CartesianChart Grid.Row="1">
            <lvc:CartesianChart.Series>
                <lvc:LineSeries Values="{Binding ChartValues}"
                                PointGeometrySize="18"
                                StrokeThickness="4" />
            </lvc:CartesianChart.Series>
            <lvc:CartesianChart.AxisX>
                <lvc:Axis LabelFormatter="{Binding DateTimeFormatter}"
                          MaxValue="{Binding AxisMax}"
                          MinValue="{Binding AxisMin}"
                          DisableAnimations="True"
                          >
                    <lvc:Axis.Separator>
                        <lvc:Separator Step="{Binding AxisStep}"></lvc:Separator>
                    </lvc:Axis.Separator>
                </lvc:Axis>
            </lvc:CartesianChart.AxisX>
        </lvc:CartesianChart>
    </Grid>
</Page>
using System;
using System.Collections.Generic;
using System.Linq;
using System.Text;
using System.Threading.Tasks;

namespace HacksterLiveChartsAnalogSensor.Models
{
    public class MeasureModel
    {
        public DateTime DateTime { get; set; }
        public double Value { get; set; }
    }
}
using System;
using System.Collections.Generic;
using System.Linq;
using System.Text;
using System.Threading.Tasks;
//******
using Windows.Devices.Spi;
using Windows.Devices.Gpio;
using Windows.Devices.Enumeration;

namespace HacksterLiveChartsAnalogSensor.Models
{
    public class MCP3008
    {
        enum ADCChip
        {
            mcp3008, // 8 channel 10 bit
        }

        ADCChip whichADCChip = ADCChip.mcp3008;

        /*RaspBerry Pi2  Parameters*/
        private const string SPI_CONTROLLER_NAME = "SPI0";  /* For Raspberry Pi 2, use SPI0                             */
        private const Int32 SPI_CHIP_SELECT_LINE = 0;       /* Line 0 maps to physical pin number 24 on the Rpi2        */

        byte[] readBuffer = null;                           /* this is defined to hold the output data*/
        byte[] writeBuffer = null;                          /* we will hold the command to send to the chipbuild this in the constructor for the chip we are using */

        private SpiDevice SpiDisplay;

        // create a timer
        //private DispatcherTimer timer;

        int res;

        public MCP3008()
        {

            //timer = new DispatcherTimer();
            //timer.Interval = TimeSpan.FromMilliseconds(10);
            //timer.Tick += Timer_Tick;
            //timer.Start();

            whichADCChip = ADCChip.mcp3008;
            switch (whichADCChip)
            {

                case ADCChip.mcp3008:
                    {
                        readBuffer = new byte[3] { 0x00, 0x00, 0x00 };
                        writeBuffer = new byte[3] { 0x01, 0x80, 0x00 };
                    }
                    break;
            }

            //InitSPI();
        }
        public async Task InitSPI()
        {
            try
            {
                var settings = new SpiConnectionSettings(SPI_CHIP_SELECT_LINE);
                settings.ClockFrequency = 500000;// 10000000;
                settings.Mode = SpiMode.Mode0; //Mode3;
                var controller = await SpiController.GetDefaultAsync();
                SpiDisplay = controller.GetDevice(settings);
            }

            /* If initialization fails, display the exception and stop running */
            catch (Exception ex)
            {
                throw new Exception("SPI Initialization Failed", ex);
            }
        }
        //private void Timer_Tick(object sender, object e)
        //{
        //    DisplayTextBoxContents();
        //}
        public Task<int> DisplayTextBoxContents()
        {

            SpiDisplay.TransferFullDuplex(writeBuffer, readBuffer);
            res = convertToInt(readBuffer);
            //textPlaceHolder.Text = res.ToString();

            return res;

        }
        public int convertToInt(byte[] data)
        {
            int result = 0;
            switch (whichADCChip)
            {
                case ADCChip.mcp3008:
                    {
                        /*mcp3008 10 bit output*/
                        result = data[1] & 0x03;
                        result <<= 8;
                        result += data[2];
                    }
                    break;
            }

            return result;
        }

    }
}
MainPage.xaml.cs
C#Finally add the code MainPage.xaml.cs file (I moved all the properties and fields to the top of the file for readability)
using System;
using System.Collections.Generic;
using System.IO;
using System.Linq;
using System.Runtime.InteropServices.WindowsRuntime;
using Windows.Foundation;
using Windows.Foundation.Collections;
using Windows.UI.Xaml;
using Windows.UI.Xaml.Controls;
using Windows.UI.Xaml.Controls.Primitives;
using Windows.UI.Xaml.Data;
using Windows.UI.Xaml.Input;
using Windows.UI.Xaml.Media;
using Windows.UI.Xaml.Navigation;
//*******
//*****
using System.ComponentModel;
using LiveCharts;
using LiveCharts.Configurations;
using HacksterLiveChartsAnalogSensor.Models;

// The Blank Page item template is documented at https://go.microsoft.com/fwlink/?LinkId=402352&clcid=0x409

namespace HacksterLiveChartsAnalogSensor
{
    /// <summary>
    /// An empty page that can be used on its own or navigated to within a Frame.
    /// </summary>
    public sealed partial class MainPage : Page, INotifyPropertyChanged
    {
        public Models.MCP3008 mCP3008;

        private double _axisMax;
        private double _axisMin;

        public ChartValues<MeasureModel> ChartValues { get; set; }
        public Func<double, string> DateTimeFormatter { get; set; }

        public double AxisStep { get; set; }

        public double AxisMax
        {
            get { return _axisMax; }
            set
            {
                _axisMax = value;
                OnPropertyChanged("AxisMax");
            }
        }
        public double AxisMin
        {
            get { return _axisMin; }
            set
            {
                _axisMin = value;
                OnPropertyChanged("AxisMin");
            }
        }

        public DispatcherTimer Timer { get; set; }
        public bool IsDataInjectionRunning { get; set; }

        public event PropertyChangedEventHandler PropertyChanged;

        public MainPage()
        {
            this.InitializeComponent();

            var mapper = Mappers.Xy<MeasureModel>()
                .X(model => model.DateTime.Ticks)
                .Y(model => model.Value);

            Charting.For<MeasureModel>(mapper);

            ChartValues = new ChartValues<MeasureModel>();

            DateTimeFormatter = value => new DateTime((long)(value)).ToString("mm:ss");

            AxisStep = TimeSpan.FromSeconds(2).Ticks;
            SetAxisLimits(DateTime.Now);

            Timer = new DispatcherTimer
            {
                Interval = TimeSpan.FromMilliseconds(10)
            };
            Timer.Tick += TimerOnTick;
            IsDataInjectionRunning = false;

            DataContext = this;
        }

        protected override async void OnNavigatedTo(NavigationEventArgs e)
        {
            mCP3008 = new MCP3008();
            await mCP3008.InitSPI();
        }

        private void RunDataOnClick(object sender, RoutedEventArgs e)
        {
            if (IsDataInjectionRunning)
            {
                Timer.Stop();
                IsDataInjectionRunning = false;
            }
            else
            {
                Timer.Start();
                IsDataInjectionRunning = true;
            }
        }

        private async void TimerOnTick(object sender, object eventArgs)
        {
            var now = DateTime.Now;

            ChartValues.Add(new MeasureModel
            {
                DateTime = now,

                //Value = await _bme280.ReadTemperature()
                Value = await mCP3008.DisplayTextBoxContents()
            });

            SetAxisLimits(now);

            if (ChartValues.Count > 300) ChartValues.RemoveAt(0);
        }

        private void SetAxisLimits(DateTime now)
        {
            AxisMax = now.Ticks + TimeSpan.FromSeconds(1).Ticks;
            AxisMin = now.Ticks - TimeSpan.FromSeconds(30).Ticks;
        }

        public void OnPropertyChanged(string propertyName = null)
        {
            if (PropertyChanged != null)
                PropertyChanged.Invoke(this, new PropertyChangedEventArgs(propertyName));
        }
    }

}

Thanks to Alberto Rodríguez and lamadio.


_3u05Tpwasz.png?auto=compress%2Cformat&w=40&h=40&fit=fillmax&bg=fff&dpr=2)
Comments
Please log in or sign up to comment.