sweetmalarkey
Published © GPL3+

Live Temperature Data

Display live temperate data from a BME280 sensor without Power BI using Windows IoT Core.

BeginnerFull instructions provided1 hour1,222

Things used in this project

Hardware components

Raspberry Pi 3 Model B
×1
Male/Female Jumper Wires
×1
Breadboard (generic)
×1
Adafruit BME280
×1

Software apps and online services

Windows 10 IoT Core
Microsoft Windows 10 IoT Core
live charts

Story

Read more

Schematics

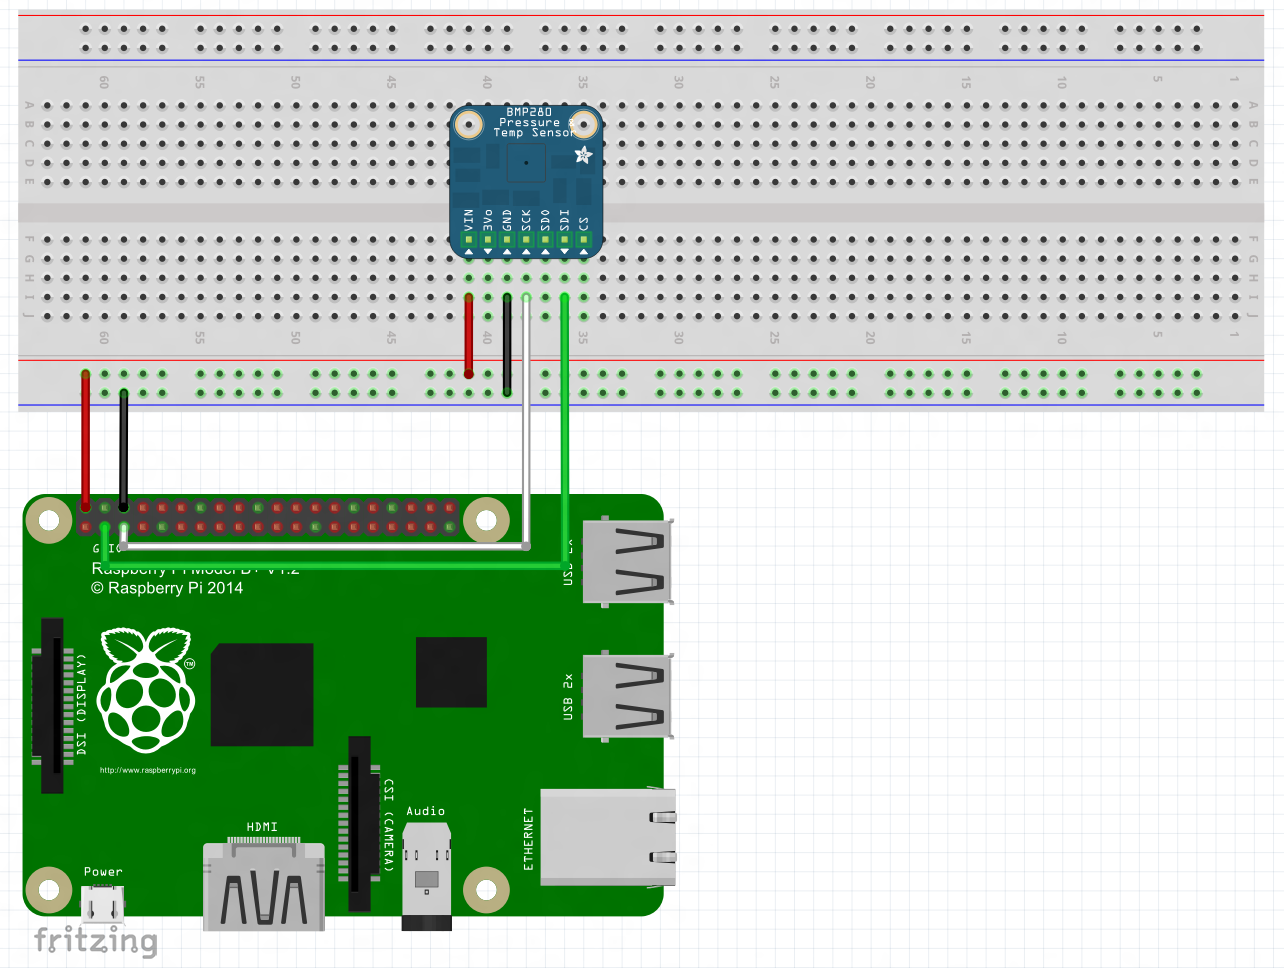
Fritzing

Wire up your raspberry pi to the BME280 sensor

Code

Model Class

C#
After adding your reference to 'Windows Iot Extensions for UWP' download and install from NuGet 'BuildAzure.IoT.Adafruit.BME280' and 'LiveCharts.Uwp'. Then we make a class for our own type.
using System;
using System.Collections.Generic;
using System.Linq;
using System.Text;
using System.Threading.Tasks;

namespace HacksterLiveChartsDemo
{
    public class MeasureModel
    {
        public DateTime DateTime { get; set; }
        public double Value { get; set; }
    }
}

MainPage.xaml.cs

C#
Next we add the code to the MainPage.xaml.cs file (I kept the example code the same as the example on the lvcharts.net tutorial for simplification).
using LiveCharts;
using LiveCharts.Configurations;
using System;
using System.Collections.Generic;
using System.ComponentModel;
using System.IO;
using System.Linq;
using System.Runtime.InteropServices.WindowsRuntime;
using Windows.Foundation;
using Windows.Foundation.Collections;
using Windows.UI.Xaml;
using Windows.UI.Xaml.Controls;
using Windows.UI.Xaml.Controls.Primitives;
using Windows.UI.Xaml.Data;
using Windows.UI.Xaml.Input;
using Windows.UI.Xaml.Media;
using Windows.UI.Xaml.Navigation;

// The Blank Page item template is documented at https://go.microsoft.com/fwlink/?LinkId=402352&clcid=0x409

namespace HacksterLiveChartsDemo
{
    /// <summary>
    /// An empty page that can be used on its own or navigated to within a Frame.
    /// </summary>
    public sealed partial class MainPage : Page, INotifyPropertyChanged
    {

        private double _axisMax;
        private double _axisMin;

        public MainPage()
        {
            this.InitializeComponent();

            //To handle live data easily, in this case we built a specialized type
            //the MeasureModel class, it only contains 2 properties
            //DateTime and Value
            //We need to configure LiveCharts to handle MeasureModel class
            //The next code configures MEasureModel  globally, this means
            //that livecharts learns to plot MeasureModel and will use this config every time
            //a ChartValues instance uses this type.
            //this code ideally should only run once, when application starts is reccomended.
            //you can configure series in many ways, learn more at http://lvcharts.net/App/examples/v1/wpf/Types%20and%20Configuration

            var mapper = Mappers.Xy<MeasureModel>()
                .X(model => model.DateTime.Ticks)   //use DateTime.Ticks as X
                .Y(model => model.Value);           //use the value property as Y

            //lets save the mapper globally.
            Charting.For<MeasureModel>(mapper);


            //the values property will store our values array
            ChartValues = new ChartValues<MeasureModel>();

            //lets set how to display the X Labels
            DateTimeFormatter = value => new DateTime((long)(value)).ToString("mm:ss");

            AxisStep = TimeSpan.FromSeconds(1).Ticks;
            SetAxisLimits(DateTime.Now);

            //The next code simulates data changes every 300 ms
            Timer = new DispatcherTimer
            {
                //Interval = TimeSpan.FromMilliseconds(300)
                Interval = TimeSpan.FromMilliseconds(1000)
            };
            Timer.Tick += TimerOnTick;
            IsDataInjectionRunning = false;
            //R = new Random(); 

            DataContext = this;
        }

        public BuildAzure.IoT.Adafruit.BME280.BME280Sensor _bme280;

        protected override async void OnNavigatedTo(NavigationEventArgs e)
        {
            _bme280 = new BuildAzure.IoT.Adafruit.BME280.BME280Sensor();
            await _bme280.Initialize();
        }

        public ChartValues<MeasureModel> ChartValues { get; set; }
        public Func<double, string> DateTimeFormatter { get; set; }

        public double AxisStep { get; set; }

        public double AxisMax
        {
            get { return _axisMax; }
            set
            {
                _axisMax = value;
                OnPropertyChanged("AxisMax");
            }
        }
        public double AxisMin
        {
            get { return _axisMin; }
            set
            {
                _axisMin = value;
                OnPropertyChanged("AxisMin");
            }
        }

        public DispatcherTimer Timer { get; set; }
        public bool IsDataInjectionRunning { get; set; }
        public Random R { get; set; }

        private void RunDataOnClick(object sender, RoutedEventArgs e)
        {
            if (IsDataInjectionRunning)
            {
                Timer.Stop();
                IsDataInjectionRunning = false;
            }
            else
            {
                Timer.Start();
                IsDataInjectionRunning = true;
            }
        }
        
        private async void TimerOnTick(object sender, object eventArgs)
        {
            // make this method asynchronous

            var now = DateTime.Now;

            ChartValues.Add(new MeasureModel
            {
                DateTime = now,
                //Value = R.Next(0, 10)

                Value = await _bme280.ReadTemperature()
            });

            SetAxisLimits(now);

            //lets only use the last 30 values
            if (ChartValues.Count > 30) ChartValues.RemoveAt(0);
        }

        private void SetAxisLimits(DateTime now)
        {
            AxisMax = now.Ticks + TimeSpan.FromSeconds(1).Ticks; // lets force the axis to be 100ms ahead
            //AxisMin = now.Ticks - TimeSpan.FromSeconds(8).Ticks; //we only care about the last 8 seconds

            AxisMin = now.Ticks - TimeSpan.FromSeconds(30).Ticks;  // changed to 30 seconds
        }

        public event PropertyChangedEventHandler PropertyChanged;

        public void OnPropertyChanged(string propertyName = null)
        {
            if (PropertyChanged != null)
                PropertyChanged.Invoke(this, new PropertyChangedEventArgs(propertyName));
        }
    }
}

MainPage.xaml

C#
<Page
    x:Class="HacksterLiveChartsDemo.MainPage"
    xmlns="http://schemas.microsoft.com/winfx/2006/xaml/presentation"
    xmlns:x="http://schemas.microsoft.com/winfx/2006/xaml"
    xmlns:local="using:HacksterLiveChartsDemo"
    xmlns:d="http://schemas.microsoft.com/expression/blend/2008"
    xmlns:mc="http://schemas.openxmlformats.org/markup-compatibility/2006"
    
    xmlns:lvc="using:LiveCharts.Uwp"  
    
    mc:Ignorable="d"
    Background="{ThemeResource ApplicationPageBackgroundThemeBrush}">

    <Grid>
        <Grid.RowDefinitions>
            <RowDefinition Height="Auto"></RowDefinition>
            <RowDefinition Height="*"></RowDefinition>
        </Grid.RowDefinitions>
        <Button Grid.Row="0" Height="30" Click="RunDataOnClick" HorizontalAlignment="Stretch">
            Inject/Stop Data
        </Button>
        <lvc:CartesianChart Grid.Row="1">
            <lvc:CartesianChart.Series>
                <lvc:LineSeries Values="{Binding ChartValues}" PointGeometrySize="18" StrokeThickness="4" />
            </lvc:CartesianChart.Series>
            <lvc:CartesianChart.AxisX>
                <lvc:Axis LabelFormatter="{Binding DateTimeFormatter}" 
                          MaxValue="{Binding AxisMax}" 
                          MinValue="{Binding AxisMin}"
                          DisableAnimations="True">
                    <lvc:Axis.Separator>
                        <lvc:Separator Step="{Binding AxisStep}"></lvc:Separator>
                    </lvc:Axis.Separator>
                </lvc:Axis>
            </lvc:CartesianChart.AxisX>
        </lvc:CartesianChart>
    </Grid>
</Page>

Credits

sweetmalarkey

sweetmalarkey

2 projects • 0 followers

Comments