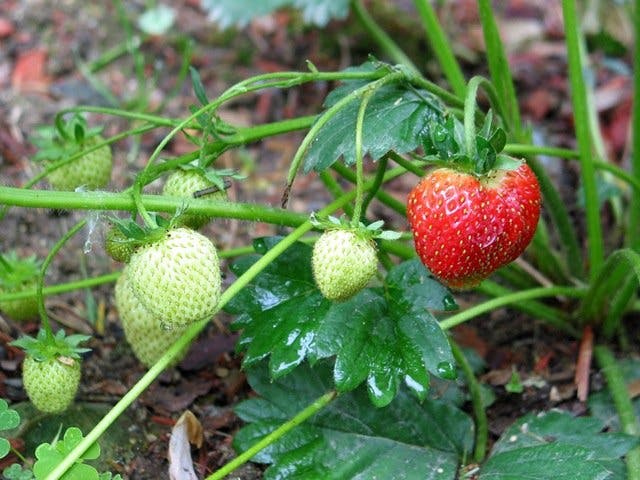
Autonomous robotic harvesting is a rising trend in agricultural applications, like the automated harvesting of fruit and vegetables. Farmers continuously look for solutions to upgrade their production, at reduced running costs and with less personnel. This is where harvesting robots come into play.
During recent years a lot of research on this topic has been performed, either using basic computer vision techniques, like colour based segmentation, or by resorting to other sensors, like LWIR, hyperspectral or 3D. Recent advances in computer vision present a broad range of advanced object detection techniques that could improve the quality of fruit detection from RGB images drastically.
Single Board Computer like Raspberry Pi and Untra96 added an extra wheel on the improvement of AI robotics having real time image processing functionality. In this project I will show how ripe fruits can be identified using Ultra96 Board. Pre-installed OpenCV image processing library is used for the project. The concept can be implemented in robotics for ripe fruits harvesting.
Hardware SetupHardware setup is very simple. Without Ultra96 board you will be required a 12V, 2A DC power supply and USB webcam. Connect the camera to the board using the USB port. Power up the board and upload the Python Notebook file using web interface or file transfer protocol.
Prepare your Ultra96 board installing the Ultra96 image. Follow the guide: http://zedboard.org/sites/default/files/documentations/Ultra96-GSG-v1_0.pdf After installing the image and connecting the board with the network run Jupytar notebook and open a new notebook. You can upload a notebook using the Upload button. A jupyter notebook file is attached in the code section.
After selecting the file click to upload button to upload the file.
OpenCV Python is used to identify the ripe fruit. Several Python modules are required like matplotlib, numpy, pandas, etc. and all the modules are pre-installed with Ultra96 board image. I have chosen a sample image from internet for showing the implementation of the code.
%matplotlib inline
import cv2
import matplotlib
from matplotlib import colors
from matplotlib import pyplot as plt
import numpy as np
from __future__ import division

#camera = cv2.VideoCapture(0)
#width = 800
#height = 600
#camera.set(cv2.CAP_PROP_FRAME_WIDTH,width)camera.set(cv2.CAP_PROP_FRAME_HEIGHT,height)
# Flush webcam buffers
#for _ in range(5):
#   ret, image = camera.read()# Read in a frame

def show(image):
   # Figure size in inches
   plt.figure(figsize=(15, 15))
   # Show image, with nearest neighbour interpolation
   plt.imshow(image, interpolation='nearest')
def show_hsv(hsv):
   rgb = cv2.cvtColor(hsv, cv2.COLOR_HSV2BGR)
   show(rgb)
def show_mask(mask):
   plt.figure(figsize=(10, 10))
   plt.imshow(mask, cmap='gray')
def overlay_mask(mask, image):
   rgb_mask = cv2.cvtColor(mask, cv2.COLOR_GRAY2RGB)
   img = cv2.addWeighted(rgb_mask, 0.5, image, 0.5, 0)
   show(img)
image = cv2.imread('berry.jpg')
import pandas as pd
m,n,r = image.shape
arr = image.reshape(m*n, -1)
df = pd.DataFrame(arr, columns=['b', 'g', 'r'])
df.describe()
# Convert from BGR to RGB
image = cv2.cvtColor(image, cv2.COLOR_BGR2RGB)
# Resize to a third of the size
image = cv2.resize(image, None, fx=1/3, fy=1/3)
show(image)
After running the above code snippet you will get following image. Be sure the image is in working directory.
# Show Red/Green/Blue
images = []
for i in [0, 1, 2]:
   colour = image.copy()
   if i != 0: colour[:,:,0] = 0
   if i != 1: colour[:,:,1] = 0
   if i != 2: colour[:,:,2] = 0
   images.append(colour)
show(np.vstack(images))
Above code snippet separate three color of the image.
def show_rgb_hist(image):
   colours = ('r','g','b')
   for i, c in enumerate(colours):
       plt.figure(figsize=(20, 4))
       histr = cv2.calcHist([image], [i], None, [256], [0, 256])
#         plt.plot(histr, color=c, lw=2)
       if c == 'r': colours = [((i/256, 0, 0)) for i in range(0, 256)]
       if c == 'g': colours = [((0, i/256, 0)) for i in range(0, 256)]
       if c == 'b': colours = [((0, 0, i/256)) for i in range(0, 256)]
       plt.bar(range(0, 256), histr, color=colours, edgecolor=colours, width=1)
#         plt.xlim([0, 256])
       plt.show()
   show_rgb_hist(image)
# Convert from RGB to HSV
hsv = cv2.cvtColor(image, cv2.COLOR_RGB2HSV)
images = []
for i in [0, 1, 2]:
   colour = hsv.copy()
   if i != 0: colour[:,:,0] = 0
   if i != 1: colour[:,:,1] = 255
   if i != 2: colour[:,:,2] = 255
   images.append(colour)
hsv_stack = np.vstack(images)
rgb_stack = cv2.cvtColor(hsv_stack, cv2.COLOR_HSV2RGB)
show(rgb_stack)
matplotlib.rcParams.update({'font.size': 16})
def show_hsv_hist(image):
   # Hue
   plt.figure(figsize=(20, 3))
   histr = cv2.calcHist([image], [0], None, [180], [0, 180])
   plt.xlim([0, 180])
   colours = [colors.hsv_to_rgb((i/180, 1, 0.9)) for i in range(0, 180)]
   plt.bar(range(0, 180), histr, color=colours, edgecolor=colours, width=1)
   plt.title('Hue')
   # Saturation
   plt.figure(figsize=(20, 3))
   histr = cv2.calcHist([image], [1], None, [256], [0, 256])
   plt.xlim([0, 256])
   colours = [colors.hsv_to_rgb((0, i/256, 1)) for i in range(0, 256)]
   plt.bar(range(0, 256), histr, color=colours, edgecolor=colours, width=1)
   plt.title('Saturation')
   # Value
   plt.figure(figsize=(20, 3))
   histr = cv2.calcHist([image], [2], None, [256], [0, 256])
   plt.xlim([0, 256])
   colours = [colors.hsv_to_rgb((0, 1, i/256)) for i in range(0, 256)]
   plt.bar(range(0, 256), histr, color=colours, edgecolor=colours, width=1)
   plt.title('Value')
#show_hsv_hist(hsv)
# Blur image slightly
image_blur = cv2.GaussianBlur(image, (7, 7), 0)
show(image_blur)
Above code snippet is used for filtering and you will get the following image.
image_blur_hsv = cv2.cvtColor(image_blur, cv2.COLOR_RGB2HSV)
# 0-10 hue
min_red = np.array([100, 100, 0])
max_red = np.array([55, 10, 51])
image_red1 = cv2.inRange(image_blur_hsv, min_red, max_red)
# 170-180 hue
min_red2 = np.array([170, 100, 60])
max_red2 = np.array([180, 256, 256])
image_red2 = cv2.inRange(image_blur_hsv, min_red2, max_red2)
show_mask(image_red1)
show_mask(image_red2)
image_red = image_red1 + image_red2
show_mask(image_red)
# Clean up
kernel = cv2.getStructuringElement(cv2.MORPH_ELLIPSE, (15, 15))
# image_red_eroded = cv2.morphologyEx(image_red, cv2.MORPH_ERODE, kernel)
# show_mask(image_red_eroded)
# image_red_dilated = cv2.morphologyEx(image_red, cv2.MORPH_DILATE, kernel)
# show_mask(image_red_dilated)
# image_red_opened = cv2.morphologyEx(image_red, cv2.MORPH_OPEN, kernel)
# show_mask(image_red_opened)
# Fill small gaps
image_red_closed = cv2.morphologyEx(image_red, cv2.MORPH_CLOSE, kernel)
show_mask(image_red_closed)
# Remove specks
image_red_closed_then_opened = cv2.morphologyEx(image_red_closed, cv2.MORPH_OPEN, kernel)
show_mask(image_red_closed_then_opened)
def find_biggest_contour(image):
   # Copy to prevent modification
   image = image.copy()
   img, contours, hierarchy = cv2.findContours(image, cv2.RETR_LIST, cv2.CHAIN_APPROX_SIMPLE)
   #print len(contours)
   # Isolate largest contour
   contour_sizes = [(cv2.contourArea(contour), contour) for contour in contours]
   biggest_contour = max(contour_sizes, key=lambda x: x[0])[1]
   mask = np.zeros(image.shape, np.uint8)
   cv2.drawContours(mask, [biggest_contour], -1, 255, -1)
   return biggest_contour, mask
big_contour, red_mask = find_biggest_contour(image_red_closed_then_opened)
show_mask(red_mask)
overlay_mask(red_mask, image)
# Centre of mass
moments = cv2.moments(red_mask)
centre_of_mass = int(moments['m10'] / moments['m00']), int(moments['m01'] / moments['m00'])
image_with_com = image.copy()
cv2.circle(image_with_com, centre_of_mass, 10, (0, 255, 0), -1)
show(image_with_com)
# Bounding ellipse
image_with_ellipse = image.copy()
ellipse = cv2.fitEllipse(big_contour)
cv2.ellipse(image_with_ellipse, ellipse, (0,255,0), 2)
show(image_with_ellipse)
Reference: Most of the code snippet is collected from the repository: https://github.com/llSourcell/Object_Detection_demo_LIVE/blob/master/demo.py


Comments
Please log in or sign up to comment.