


Hardware components | ||||||
| × | 1 | ||||
| × | 1 | ||||
| × | 1 | ||||
| × | 1 | ||||
| × | 1 | ||||
Software apps and online services | ||||||
 |
| |||||
| ||||||
 |
| |||||
Hand tools and fabrication machines | ||||||
 |
| |||||
RECAP REPORT
Purpose
Intelligent Thermostat
Objectives
The thermostat must be able to acquire the information about temperature, humidity and the
possible presence of a person in the room. In addition, the device allows you to control the
system terminal’s switching on.
Solution
Device realized using:
▪ Wemos (microcontroller board)
▪ Temperature and humidity sensor
▪ Blynk (application)
Project structure
The project structure’s description will be examined in depth in the following points.
INTRODUCTIONWe want to realise a “smart” thermostat similar to other commercial products like Tado° or Netatmo. The intelligent thermostat must be able to gradually acquire the habits of the people present in the room where the sensors are installed; for this purpose the it must:
▪ detect the presence or absence of persons in the room;
▪ measure the information about temperature and humidity;
▪ load all the information on a cloud space.
Additionally the intelligent thermostat is able to activate a relay to switch on and switch off a boiler (ON- OFF boiler), based on a defined programming or with a remote control.
PURPOSEThe dispositive built will have the following features:
• Misuration the instant value of humidity and temperature with opportunity frequency (es. Once time a minute)
• Update of data on cloud operating system (Blynk, Thingsboard)
• Save the data on SD card like a security backup
• Piloting by remote the relay (that’s able to manage the boiler)
After, with a data samples, it will do a calculation of the following points:
• Drop speed of the temperature when the boiler is off
• Rise speed of the temperature when the boiler is on
• A graphic representation of hourly presence of people in the local area during the day (24 hours), getted after an opportunity time of sampling (es. some days)
REQUESTSREQUEST 1
The first request is to be able to manage the relay (on/off) of the heating system with a remote control.
REQUEST 2
The second is, instead, to be able to upload the data of humidity, temperature and state of the boiler (on/off) on a cloud operating system.
REQUEST 3
The third is, in conclusion, to use the dispositive on a local (es. student’s room) and, after a
time of data sampling, create a graphical representation with appropriate considerations.
DIAGRAM SYSTEMTo satisfy the requests have been used different solutions, reported by next:
• Use the app Blynk to manage the control of heating system by remote
• Use the app Blynk and Micro SD Card to save the data
• Use the service of Google Sheets to create a graphical representation of the local, after the data sampling
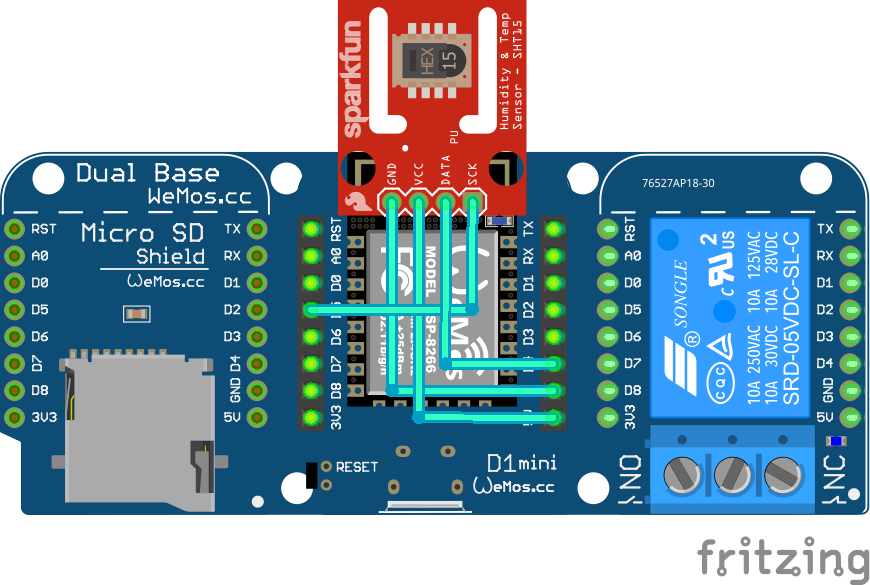
STRUCTURE DEVICEMATERIALS USED
The materials used for build the dispositive are the following:
• Microcontroller board Wemos D1 mini
• SHT30 shield
• relè shield
• micro SD shield
• tripler base
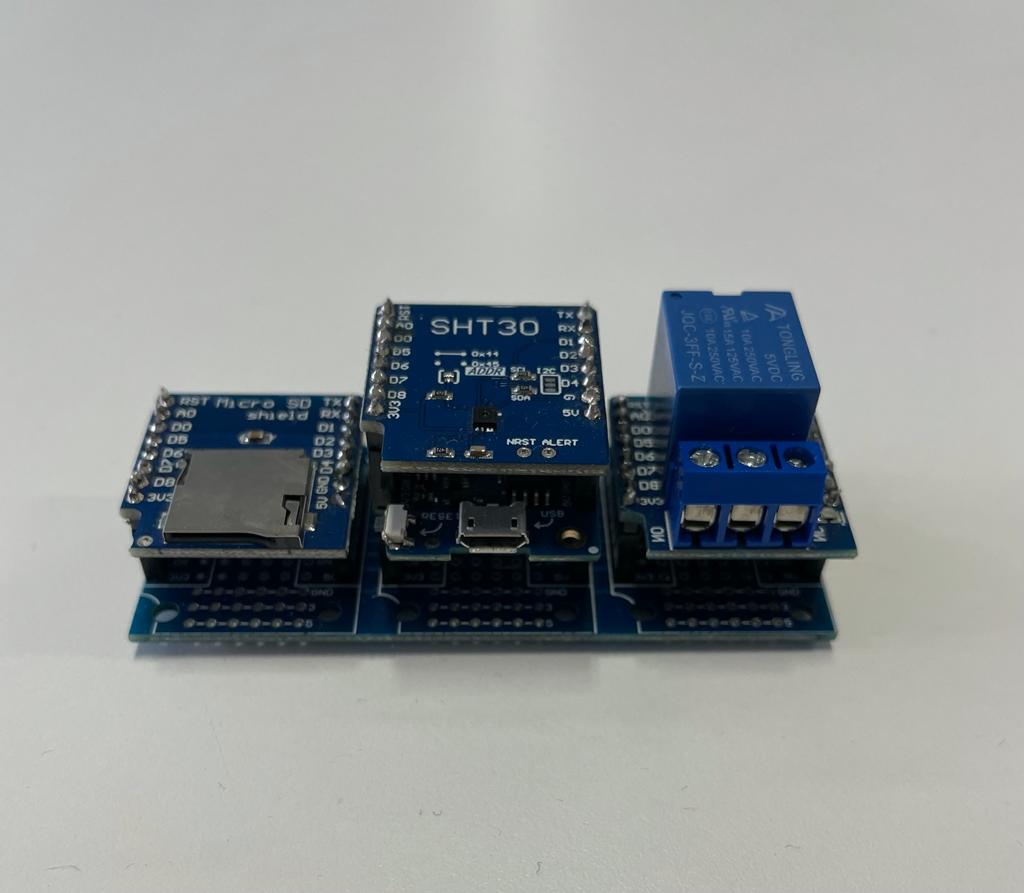
PHOTO OF DEVICE
PROBLEM FOUND
One of the hardware problems encountered was that due to mounting on a single base of each shield. As each of them uses preset pins the relay and the SHT30 sensor, when used together, give problems. To solve this it was necessary to reconnect the contacts that led from wemos to each shield in order to make everything work correctly.
Follows an image of this intervention.
FLOWCHART
For our project the logic of the program is represented by the following flowchart
FUNCTIONING CODE
The code is made by different sections:
1. Set the Library used after
2. Wifi reference and variable declaration
3. Position survey
4. Wifi connection
5. Update date and time
6. Control state of the boiler
7. Save data micro SD card
8. Send data on Google Sheets
9. Send on Blynk
BLYNK APP WINDOWS
This is the windows of the project on Blynk App.
The part of which it is made by:
● GPS positions of mobile in real time
● Switch ON or OFF the boiler
● See the values of Temperature and Humidity in real time
● See the presence of the person (yes = led on, not = led off)
● See the graphic about the history of Temperature, Humidity and presence by the person in the local
LOCAL USED
To test the dispositive, it was put in a test general room and the data have been taken for some weeks.
TOOLS
In order to be able to create a prospectus of the collected data, it was decided to implement the list already present in order to transmit the data on google sheets promptly updated with the temperature and humidity values present inside the room.
INFORMATION ELABORATION
All the information that have been obtained, during the misuring, have been send to a Google Sheet where were made some elaboration to know information about:
● The average temperature and humidity at every hour, in the room
● The temperature droop speed in the room
● The temperature low speed in the room
About the first point, a graph was made where the average temperature and humidity information was written at every hour (for example from 1.00 to 2.00) on each day of the week. With this information, graphs were created to know the trend of each day. All cell information is written automatically, except the cell where the day of the week is; in this case, in the "info" dimension, the last cell has been written with the day saved and then you can search for this cell and repeat the function until you need it.
DATA SAMPLES
During the period from 02/05 to 07/05 the dispositive have misurated these values. This graphic represents the normal trend of the conditions that there are in a room. The particular croll of Temperature that is on the middle of 03/05 it’s caused because there was nobody in the local area and the heating didn't start.
These generics data represent the trend over a long period to see if there are strange jolts and possible problems of the heating program.
DROOP SPEED
If you take for example the Monday (02/05), the boiler on program control is started at 8.00 A.M in the morning and after half an hour the local reached the set condition.
So approximately it has to consider this time where the room needs to be brought from low temperature (17.5 °C) to high temperature (19.0 °C).
It can be noted that when the desired temperature was reached there was a small transient period where the boiler will probably be:
1. print off, because there was no longer the request to heat
2. after it is switched on again, because the temperature in the room has dropped
LOW SPEED
On Saturday, instead, a test was made to switch off the boiler after a certain period of heating. It can be seen how, after 12 noon, the temperature started to drop quickly and after two hours the room reached its stable condition.
Assuming that this shutdown period corresponds to the lunch break and noting that in the afternoon the room will have to return to higher temperatures again, you could decrease the cooling speed of the room so as not to have to intervene again later.
SUMMARY PRESENCE
To study the presence of the person in the local has been done a chronological graphic where show up this considerations:
● During the night the person was in the local because sleeps, but it is not necessary to heat
● During the morning, it’s necessary to switch on the boiler and the temperature must be stay on the set conditions
● When there is the lunch, from 13.30 to 15.30, and anyone there is in the local the heating can be turn off
● In the afternoon, after 15.30, the temperature must again be at the set conditions because the presence is on
To improve the heating performance you could:
1. turn on during the night so that when the person wakes up it is already warm
2. turn off the heating when no one is around
3. on anticipation of a possible return in the afternoon, start heating a few moments earlier
The links of the sites used in the development of this project are shown below:
● https://www.wemos.cc/en/latest/d1/d1_mini.html
● https://www.mischianti.org/it/2020/08/08/protocollo-ntp-fuso-orario-e-ora-legale-dst-con-esp8266-esp32-o-arduino/
● https://www.youtube.com/channel/UCIRkmAFFSzlUgDJuFvgd3hA/playlists
● https://youtu.be/okNECYf2xlY
● https://youtu.be/1DS8dm7RIIQ
● https://randomnerdtutorials.com/esp8266-pinout-reference-gpios/


Comments
Please log in or sign up to comment.