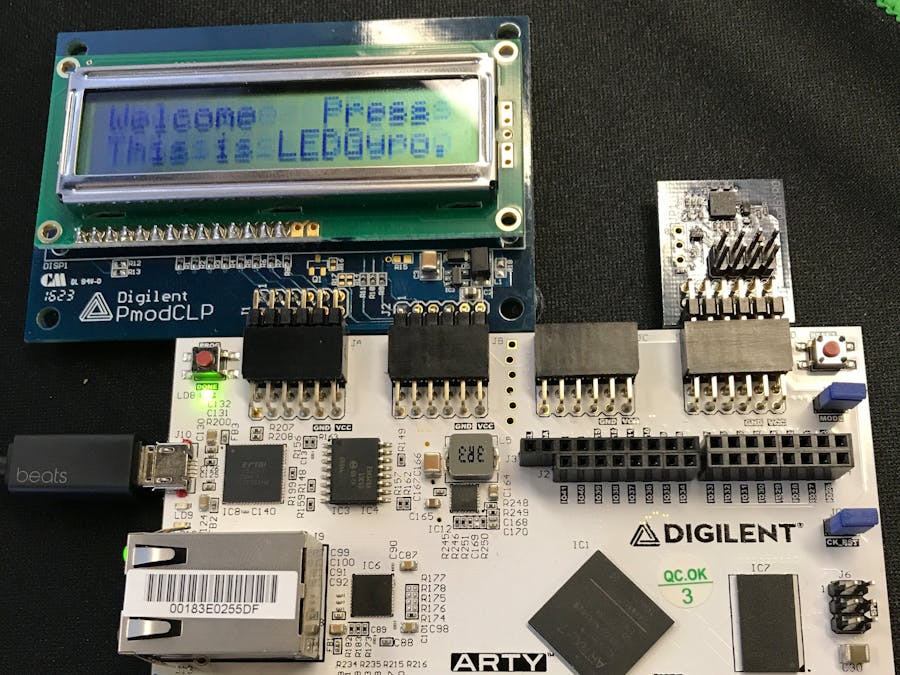
Using the Digilent Arty FPGA platform to read sensor data from a gyrometer and display the data on an LCD 16x2 character display, and dynamically power four RGB LEDS.
This project utilizes three components:
- Digilent ARTY (FPGA platform)
- Digilent PmodGYRO (gyroscope with SPI communication)
- Digilent PmodCLP (parallel 16x2 LCD display)
For this project, the character LCD display is plugged into Pmod ports JA and JB on the ARTY, with JA connecting to the dual-line pins on the CLP. The PmodGYRO is connected to the JD Pmod port.
The focus of this project was to take data from the gyroscope and find some fun ways to display it and utilize the RGB LEDs that are incorporated on the ARTY.
Though I love HDLs, it seemed obvious to me to implement this through a C program written for the MicroBlaze soft-core processor. All of the data manipulation and communication with the Gyro, and driving of the LCD display is done through software. The PWM component for the LEDs, however, is implemented through Verilog.
Vivado partThe project was designed using Xilinx Vivado (for block design and IP incorporation) and Xilinx SDK (for software design and debugging).
Luckily, their is a custom IP block maintained by Digilent for the GYRO, which can be found on their GitHub. The repo also contains some example code for utilizing the Gyro within the MicroBlaze softcore processor that can be implemented in the FPGA. This example code was incredibly helpful and contained a library for obtaining temperature and acceleration data from the Gyro. For this project I decided to disregard the temperature data of the Gyro and focus solely on the acceleration measurements in the x, y, and z directions.
Each measurement is pulled into the software program over SPI, using the given GYRO library. I then run these measurements through a couple comparisons and try to weight which is measurement is the largest. I also average the last 50 values for each axis, as these gyros are prone to spikes in readings due to slight vibrations.
Ultimately, the goal was to tie a specific axis measurement to a specific color to display on the RGB LEDs. The different color combinations were accomplished with the given PWM IP core.
- Blue maps to X
- Green maps to Y
- and Red maps to Z
Finally, given specific switch values on the ARTY, you can display only the color and data for a given axis.
When SW1 and SW0 are:
- 1 -- X only is displayed on the LEDS and LCD
- 2 - Y only is displayed on the LEDS and LCD
- 3 - Z only is displayed on the LEDS and LCD
- anything else - the weighted colors are displayed for all axes
Finally, I wrote a driver for the LCD display in C, and wrote a custom IP connecting specific memory locations for the microblaze to the JA and JB PMOD headers on the arty. This took some manipulation of the constraints file, which I have included on the project repo.
When initialized, the LCD displays the axis data as selected by the switches. Additionally, if all axes are to be displayed, it displays the axis with the greatest acceleration.
Upon boot, the user can press button 0 to start the gyro readings and button 1 to stop reading.


Comments