

Software apps and online services | ||||||
 |
| |||||
| ||||||
 |
| |||||
Predictive analysis of the machines is very necessary in order to minimize the downtime of the machine. Regular check up helps in enhancing the duty time of the machine and in turn enhances its fault tolerance. Wireless Vibration and Temperature sensors can help us to analyse the vibration in the machine. We have seen in our previous blogs that how the wireless vibration and temperature sensors served different applications and helped us in fault detection and irregular vibrations in the machine.
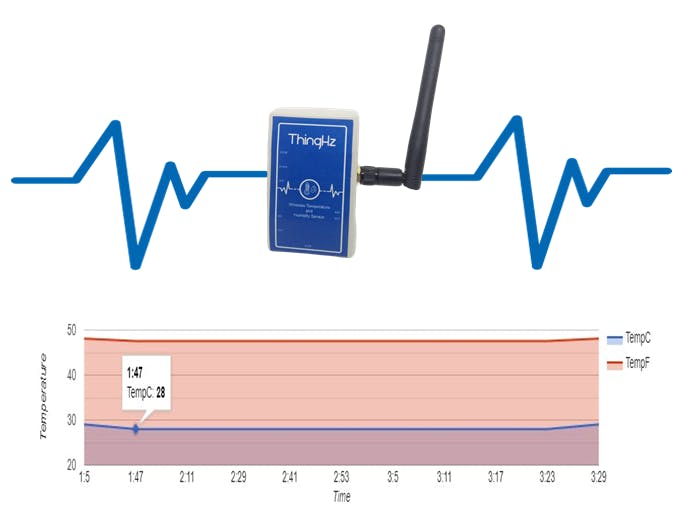
In this blog we will be using Google Charts to visualize the sensor data. Google charts are the interactive way to examine and analyzing the sensor data. It provides us many options like line charts, pi charts, Histogram, multi value charts etc. So, here we will be learning about the following:
- ThingHz Wireless Temperature and Humidity Sensor
- Hardware Setup
- Gathering the data using Wireless gateway device
- Vibration analysis using these Sensors.
- How to make a webpage using ESP32 webserver.
- Load google charts in the webpage.
- ThingHz Temperature and Humidity Sensor
First of all we will be hosting a web page using ESP32. To host a web page we just need to follow these steps:
- include library "WebServer.h"
#include "WebServer.h"- Then initialize an object of Web Server class. Then send a server request to open the web pages at root and other URL's using server.on(). and begin the server using server.begin().
Webserver server  server.on("/", handleRoot);server.on("/dht22", handleDHT);
server.onNotFound(handleNotFound);
server.begin();- Now call the callbacks for different URL paths we have stored the web page in SPIFFS. for more on SPIFFS follow this blog. The "/dht22" URL path will give the value of sensor data in JSON format.
void handleRoot() {File  file = SPIFFS.open("/chartThing.html", "r");
server.streamFile(file,"text/html");
file.close();}void handleDHT(){StaticJsonBuffer<100> jsonBuffer;
JsonObject& root = jsonBuffer.createObject();
root["rmsx"] = rms_x;
root["rmsy"] = rms_y;
char jsonChar[100];
root.printTo((char*)jsonChar, root.measureLength() + 1);
server.send(200, "text/json", jsonChar); }- Now create a HTML web page using any text editor, we are using notepad++ in our case. To know more about creating web pages go through thisblog. Here in this web page we are calling google charts API feeding the sensor values to the charts. This web page is being hosted at root web page. You can find the HTML web pagecode here.
- In the next step we just need to handle the web server.
server.handleClient();Google Charts provides very efficient way to visualize data on your website or static web pages. From simple line charts to complex hierarchical tree maps, the google chart gallery provides a large number of ready-to-use chart types.
Overall CodeThe firmware for this blog can be found here.


Comments