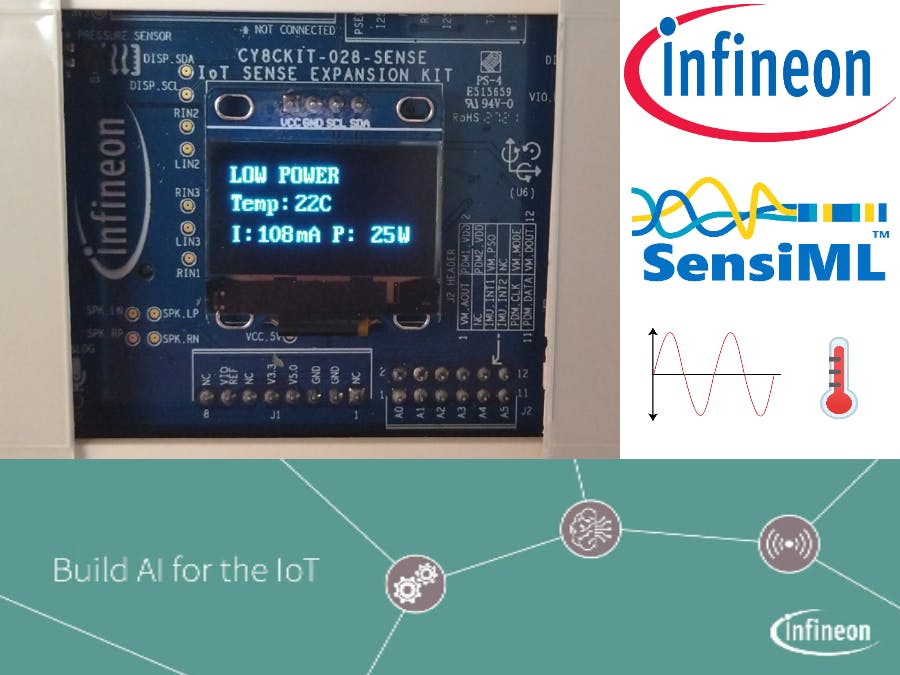
Non invasive load monitoring (NILM) is a way to detect what appliances are used in a electrical system. Current and or voltage signals are analyzed in different ways to get a load fingerprint and detect similar patterns occurring in the network. The possibility to create a cheap and reliable NILM device allows for many use cases: appliance-based energy billing, usage pattern analysis, fault detection, smart grid management and more. The usage of machine learning (ML) in this scenario seems the most promising approach, especially on powerful SoCs such as Infineon PSoC™ 62 Performance Line. This project makes use of the PSoC 62S2 Wi-Fi BT Pioneer Kit board and CY8CKIT-028-SENSE expansion, together with a ZMCT103C shield to provide high speed (2kHz) current measurement, ML interference and data handling.
SoftwareThe software was developed using the ModusToolbox IDE, that provides fast access to tools, documentation and code libraries. To import the project extract the "MLLIproject.zip" file available in the GitHub repository to a folder in your PC. Open ModusToolbox and under "File" select "Import". Select "General" and then "Existing Projects into Workspace".
The utilities.h file contains the use defined parameters:
#define APPLICATION_RUNNING_MODEhas to be configured either DATA_CAPTURE_RUNNING_MODE or RECOGNITION_RUNNING_MODE (default).
DATA_CAPTURE_RUNNING_MODE runs a minimal version of the program: every 660us (2000Hz) the ADC subsystem reads the value from pin 10_7 and sends the value to SensiML Data Capture Lab.
RECOGNITION_RUNNING_MODE runs the complete firmware.
- Every 660us (2000Hz) the ADC subsystem reads the value from pin 10_7, runs the interference engine and determine the appliance in use. Model results are printed to the serial interface;
- Every 2s the OLED display is updated with the most recent values;
- Every 5s the ambient temperature is read from XENSIV Barometric Air Pressure Sensor, then current and power usage is calculated by the current sensor.
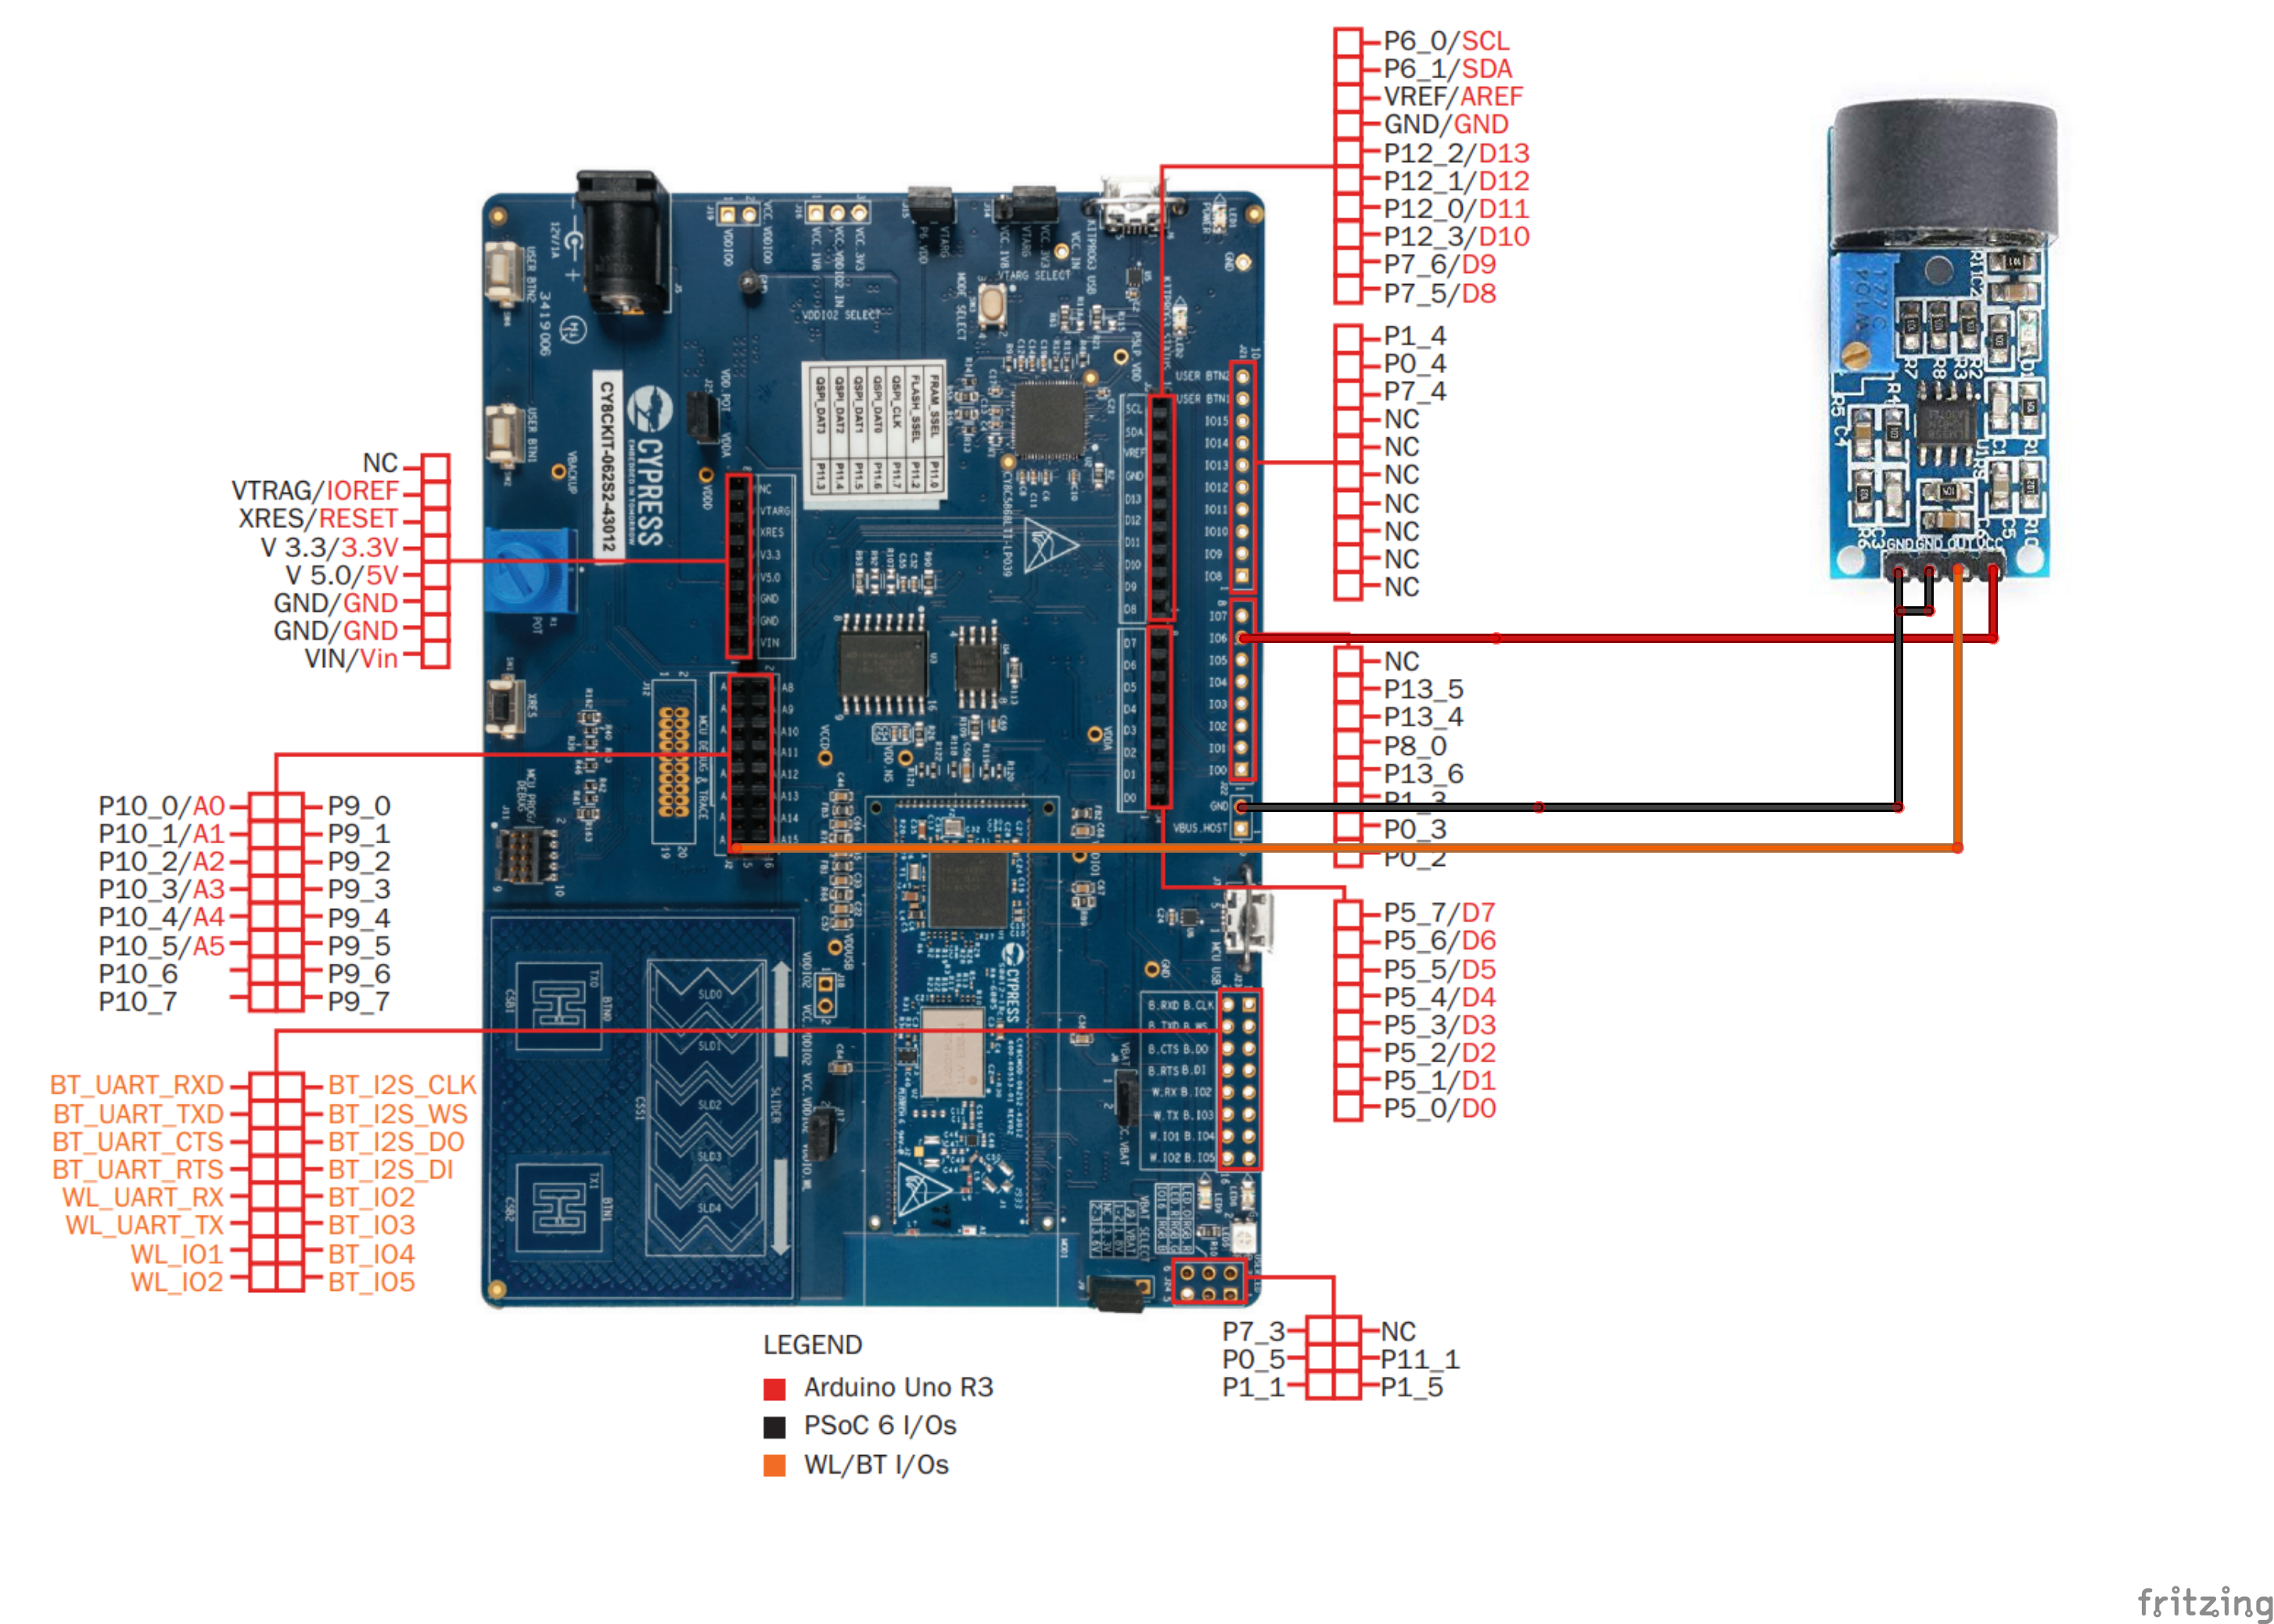
The Pioneer Kit does not expose connections to 3.3V and GND rails, so I decided to solder connectors on both J10 and J22 headers. GND is directly available on J10, 3.3V is obtained by turning the P10_6 pin HIGH via software. ZMCT103C draws less than 20mA and does not exceed the maximum current per pin of the microcontroller. Connect the current sensor to the board using Dupont cables respecting the diagram provided below.
Optionally, the components can be integrated in a demonstrative electrical installation, as visible in the photos. I made a 3D printed adapter for DIN mounting and the board was fixed in position using double-sided tape. The file 3d-din-rail-mount-clip2.stl is derived from the RemoteQTH project.
As soon as it is powered, all the peripherals are initialized. ADC performs calibration to find the zero-current value, so no load should be applied during this phase. The interference model is started immediately after.
The model provided is intended as Proof-of-concept and is trained to distinguish between: no load, low power load (small appliances and light bulbs), Vacuum cleaner, PC and heater. The OLED display shows the detected appliance, ambient temperature and calculated current and Power. Power factor has not been taken into account for simplicity, but it is safe to assume a value near 1 for a domestic environment.
When in data capture mode, the board only initialize the ADC and serial interface. After boot, every 500ms the sample data description is sent via serial. Once connected to the data capture lab, the board begins to send the sensor reading with a 2kHz rate. The.ssf plugin for this project is available in the zip file.
My project is a proof of concept but is a starting point for a customer-grade device.
The ML model has endless possibilities for improvement and expansion. More data would allow the recognition of a greater number of devices, or even recognition through the inrush current. Leveraging the integrated Wi-Fi capabilities would also allow some interesting functions, such as over-the-air updates and sample collection (with user consent).
Implementing a dashboard would allow the user to obtain information related to energy consumption and manage it better. This is feasible by leveraging the integrated Wi-Fi capabilities. The device could even be configured to inform the user if actions has to be taken (for example turning off the heating system if the temperature reaches a certain threshold).


Comments
Please log in or sign up to comment.