Thanks to the tutorials on Docs.microsoft.com - https://docs.microsoft.com/en-us/azure/iot-hub/iot-hub-raspberry-pi-kit-node-get-started#create-an-iot-hub
Prepare your Azure accountsYou might need follow the steps to create an Azure IoT hub
https://docs.microsoft.com/en-us/azure/iot-hub/iot-hub-raspberry-pi-kit-node-get-started#create-an-iot-hub
and a Power BI account. (Try Power BI for free)
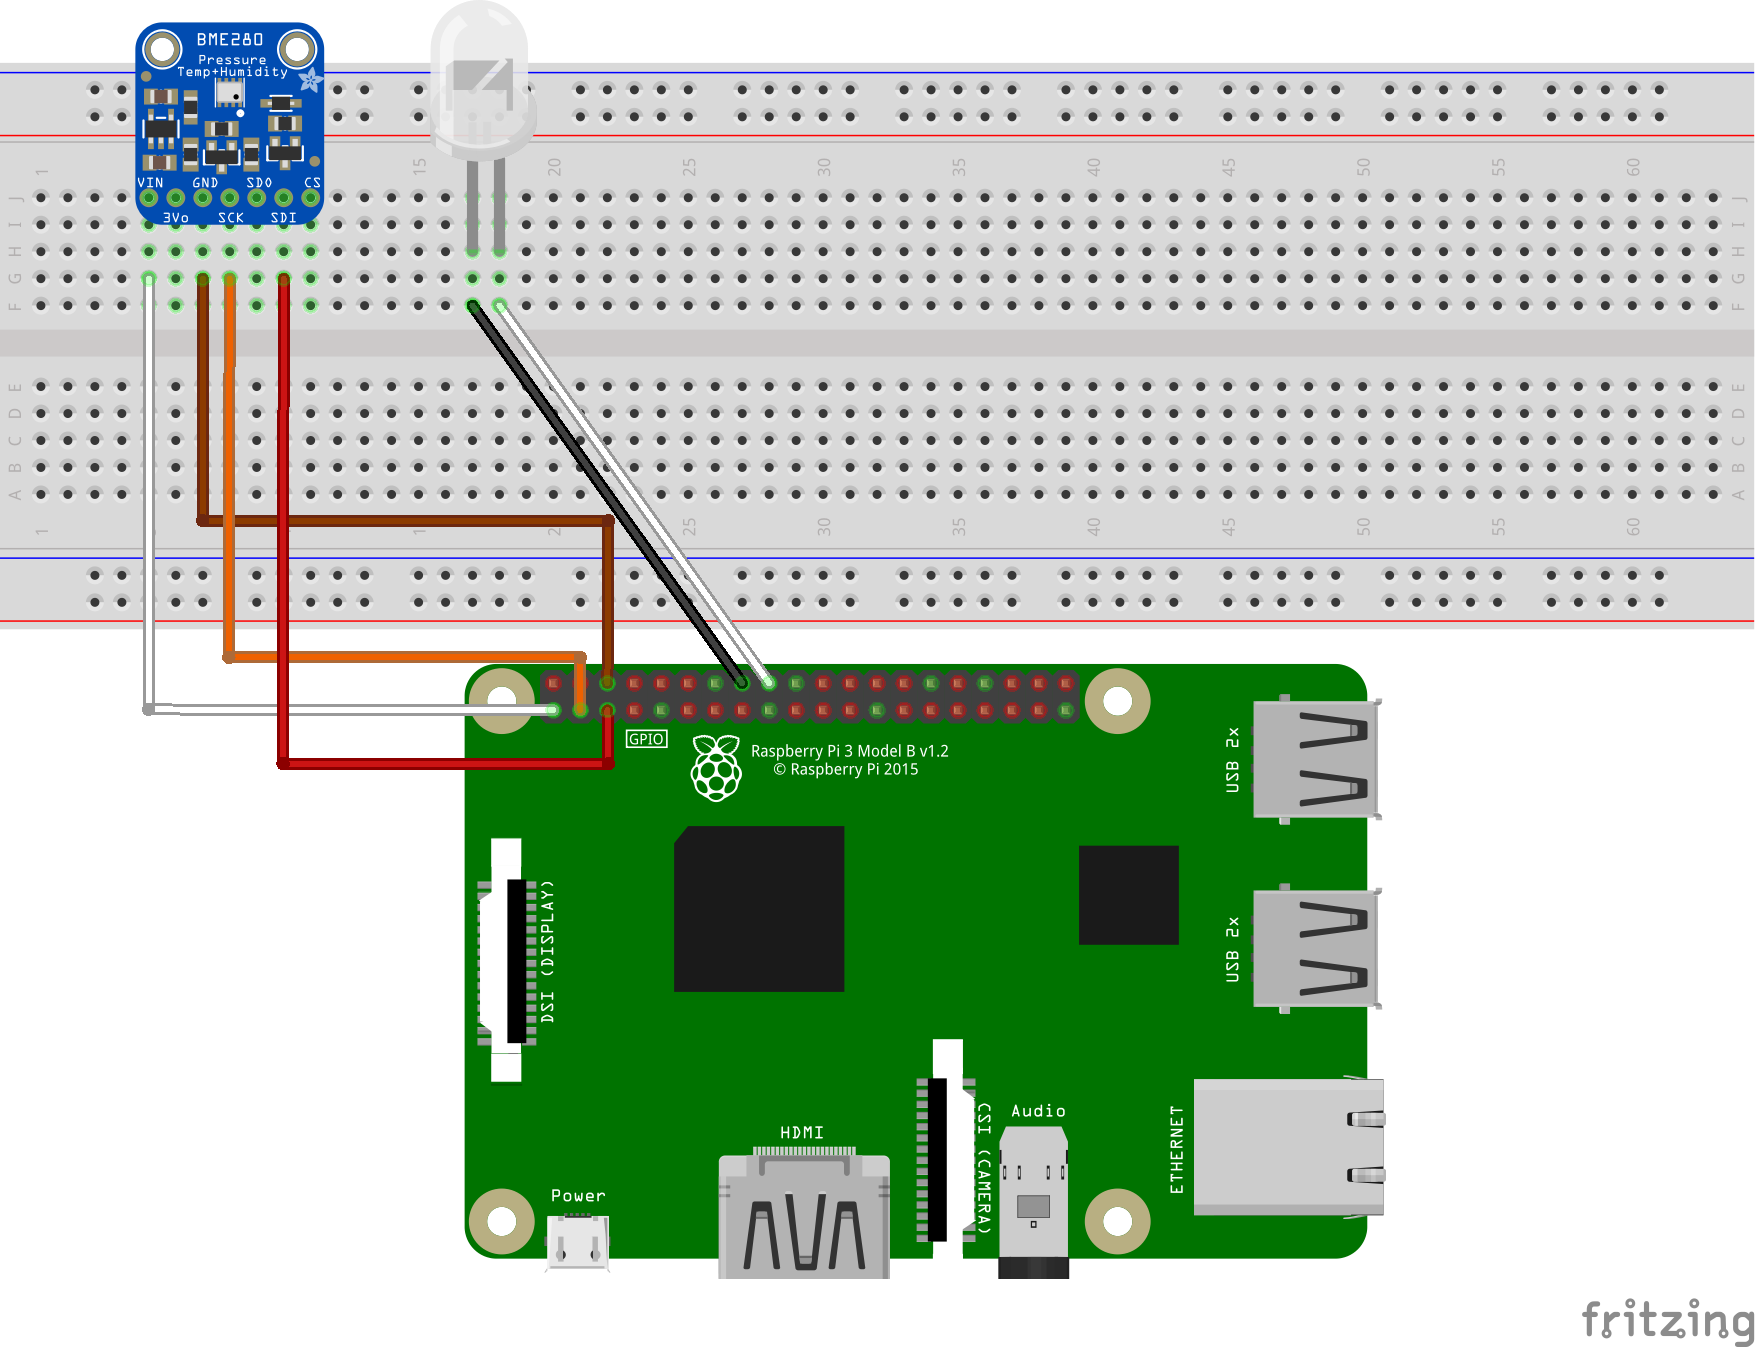
Connect the sensor to PiConnect the sensor to PiUse the breadboard and jumper wires to connect an LED and a BME280 to Pi as follows. If you don’t have the sensor, skip this section.
For sensor pins, use the following wiring:
Start (Sensor & LED) | End (Board) | Cable ColorVDD
(Pin 5G)3.3V | PWR (Pin 1) | White cable
GND (Pin 7G) | GND (Pin 6) | Brown cable
SCK (Pin 8G) | I2C1 SDA (Pin 3) |Orange cable
SDI (Pin 10G) | I2C1 SCL (Pin 5) |Red cable
LED VDD (Pin 18F) | GPIO 24 (Pin 18) |White cable
LED GND (Pin 17F) |GND (Pin 20) |Black cable
Click to view Raspberry Pi 2 & 3 Pin mappings for your reference.
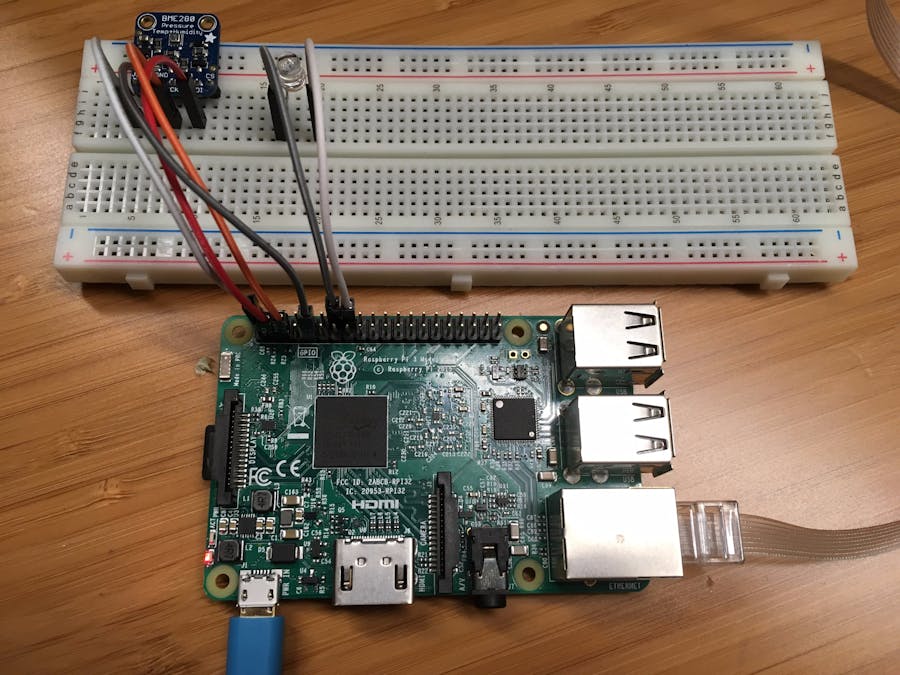
After you've successfully connected BME280 to your Raspberry Pi, it should be like below image.
Turn on Pi by using the micro USB cable and the power supply. Use the Ethernet cable to connect Pi to your wired network or follow the instructions from the Raspberry Pi Foundation to connect Pi to your wireless network.
- Use one of the following SSH clients from your host computer to connect to Intel NUC.
- PuTTY for Windows.
- The built-in SSH client on Ubuntu or macOS.
- Clone the sample application by running the following command: Copybash
git clone https//github.com/Azure-samples/iot-hub-node-raspberry-pi-clientapp
- Install all packages by the following command. It includes Azure IoT device SDK, BME280 Sensor library and Wiring Pi library. Copybash
cd iot-hub-node-raspberry-pi-clientapp npm installNote It might take several minutes to finish this installation process denpening on your network connection.
- Open the config file by running the following commands: Copybash
nano config.json
There are two items in this file you can configurate. The first one is interval
, which defines the time interval between two messages that send to cloud. The second one simulatedData
,which is a Boolean value for whether to use simulated sensor data or not. If you don't have the sensor, set the simulatedData
value to true
to make the sample application create and use simulated sensor data.
- Save and exit by pressing Control-O > Enter > Control-X.
- Run the sample application by running the following command: Copybash
sudo node index.js '<your Azure IoT hub device connection string>'Note Make sure you copy-paste the device connection string into the single quotes.
You should see the following output that shows the sensor data and the messages that are sent to your IoT hub.
Consumer groups are used by applications to pull data from Azure IoT Hub. In this lesson, you create a consumer group to be used by a Stream Analytics job to read data from your IoT hub.
To add a consumer group to your IoT hub, follow these steps:
- In the Azure portal, open your IoT hub.
- Click Endpoints on the left pane, select Events on the middle pane, enter a name under Consumer groups on the right pane, and then click Save.
- In the Azure portal, click New > Internet of Things > Stream Analytics job.
- Enter the following information for the job. Job name: The name of the job. The name must be globally unique. Resource group: Use the same resource group that your IoT hub uses. Location: Use the same location as your resource group. Pin to dashboard: Check this option for easy access to your IoT hub from the dashboard.
- Click Create.
- Open the Stream Analytics job.
- Under Job Topology, click Inputs.
- In the Inputs pane, click Add, and then enter the following information: Input alias: The unique alias for the input. Source: Select IoT hub. Consumer group: Select the consumer group you just created.
- Click Create.
- Under Job Topology, click Outputs.
- In the Outputs pane, click Add, and then enter the following information: Output alias: The unique alias for the output. Sink: Select Power BI.
- Click Authorize, and then sign into your Power BI account.
- Once authorized, enter the following information: Group Workspace: Select your target group workspace. Dataset Name: Enter a dataset name. Table Name: Enter a table name.
- Click Create.
- Under Job Topology, click Query.
- Replace
[YourInputAlias]with the input alias of the job.
- Replace
[YourOutputAlias]with the output alias of the job.
- Click Save.
In the Stream Analytics job, click Start > Now > Start. Once the job successfully starts, the job status changes from Stopped to Running.
- Ensure the sample application is running. If not, run the following command to run the application on Pi: Copybash
gulp run
- Sign in to your Power BI account.
- Go to the group workspace that you set when you created the output for the Stream Analytics job.
- Click Streaming datasets. You should see the listed dataset that you specified when you created the output for the Stream Analytics job.
- Under ACTIONS, click the first icon to create a report.
- Create a line chart to show real-time temperature over time.
- On the report creation page, add a line chart.
- On the Fields pane, expand the table that you specified when you created the output for the Stream Analytics job.
- Drag EventEnqueuedUtcTime to Axis on the Visualizations pane.
- Drag temperature to Values. Now a line chart is created. The x-axis of chart displays date and time in the UTC time zone. The y-axis displays temperature from the sensor.
- Create another line chart to show real-time humidity over time. To do this, follow the same steps above and place EventEnqueuedUtcTime on the x-axis and humidity on the y-axis.
- Click Save to save the report.
- Click File > Publish to web.
- Click Create embed code, and then click Publish.
You're provided the report link that you can share with anyone for report access and a code snippet to integrate the report into your blog or website.
Microsoft also offers the Power BI mobile apps for viewing and interacting with your Power BI dashboards and reports on your mobile device.


_3u05Tpwasz.png?auto=compress%2Cformat&w=40&h=40&fit=fillmax&bg=fff&dpr=2)
Comments
Please log in or sign up to comment.