

Hardware components | ||||||
 |
| × | 1 | |||
_zhWsCcSEcl.jpg?auto=compress%2Cformat&w=48&h=48&fit=fill&bg=ffffff) |
| × | 1 | |||
 |
| × | 1 | |||
 |
| × | 5 | |||
 |
| × | 1 | |||
 |
| × | 1 | |||
 |
| × | 1 | |||
 |
| × | 3 | |||
Software apps and online services | ||||||
 |
| |||||
| ||||||
Like many others, I had always grown up being told to avoid certain places in my neighborhood and avoid being out after certain hours. While I'm still cautious when I go out, I thought it would be interesting to see if there's actually a trend with the number of reported incidents (battery and assault) that occur within a given time interval.
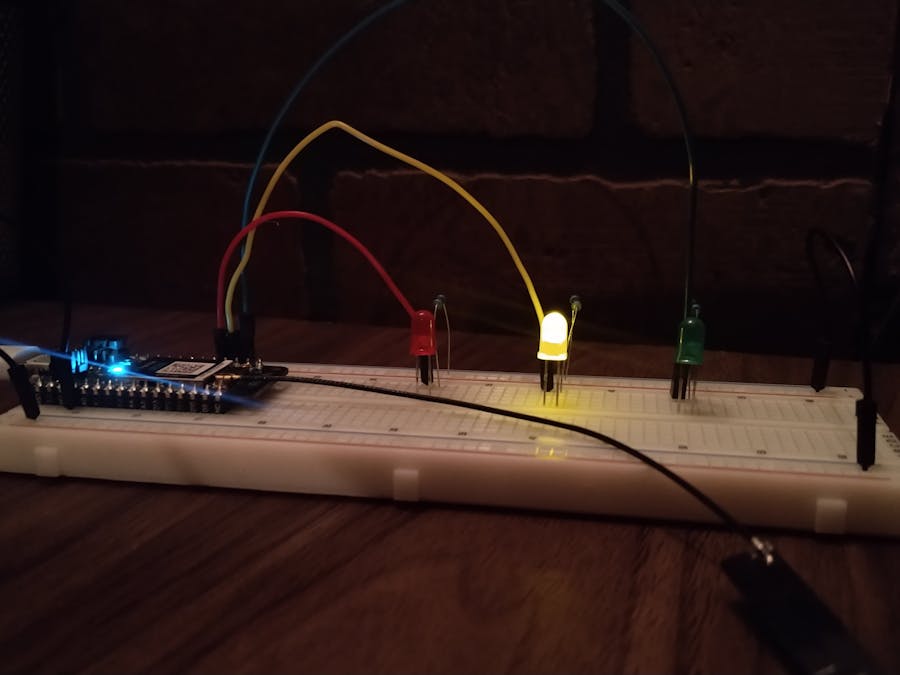
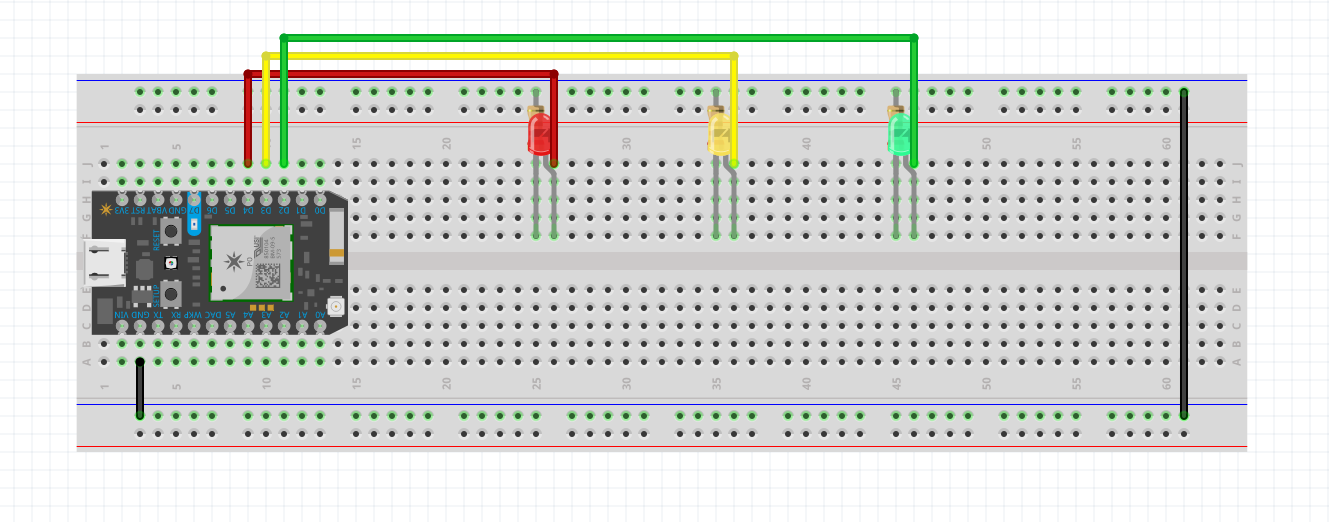
Hardware Setup:- Place the Particle Argon on the breadboard
- Using a jumper wire, connect the GND pin of the Particle Argon to the negative rail on the breadboard.
- Using another jumper wire, connect both negative rails on the breadboard.
- Using a third jumper wire, connect D4 to the positive end of the red LED (the long side).
- Using a 220 Ohm resistor, connect the negative rail of the breadboard to the negative end of the red LED (the short side)
- Repeat the previous 2 steps for the remaining LEDs. The yellow LED should be connected to D3 and the green LED to D4.
I used the Socrata Open Data API to get my data. More specifically, I used their “Crimes - 2020” database, which logs all reported incidents of crime, categorizes them based on what type of crime it was, when it happened (date and time), what community it occurred in, and other miscellaneous data.
The API is free to use and is updated daily. However, it only displays data from 2001 to the present, minus the most recent seven days.
In other words, it only reflects data up to last week. Since I’m only interested in analyzing trends in aggregate data, I don’t think this limitation is of any substantial significance.
Setting Up Your WebHook:- Go to the Particle Console > Integrations > WebHook
- Under the "Custom Template" tab, copy the following code. Please note that the "community_area" in the URL will differ for everyone.
- "event" → a variable that will trigger your integration. I called mine "info" because I was retrieving information from the API, but it really doesn't matter what you call it, you just need to be consistent with it.
- "url" → AHA! This URL links to the Socrata Crimes dataset! The fun thing about the Socrata API is that they allow you to filter your data directly on the URL using SoQL Queries. To decipher its otherwise confusing format, it's filtering the otherwise lengthy data to only retrieve the date of battery and assault cases that occurred after '2021-01-01' in a specified community area (find yours here). Once you change the community_area to your respective neighborhood, use URL formatting to put it in the WebHook Integration.
https://data.cityofchicago.org/resource/crimes.json?$query=SELECT date WHERE date > '2021-01-01' AND community_area = '58' AND (primary_type = 'BATTERY' OR primary_type ='ASSAULT')
- "X-App-Token" → the app token. You technically don't need it, but it's better to have one. You can get one here.
Since our webhook returns an array of case dates that occurred after January 01, 2021, we still need to filter the data to get the cases from last week and then filter it again so as to only look at that date's data in four-hour intervals.
*For clarification: by last week's date, I mean that if today is Monday (01-18-21), it retrieves the data from last week Monday (01-11-21) = Today's date - 7 days.
The following are brief descriptions for each of the methods used in my code:
getDate(): uses the Time library to retrieve last week's date (today's date - 7), makes sure the date isn't negative, and then concatenates a String of the date in YYYY-MM-DD format.
getHour(): uses the Time library to retrieve the time interval we're interested in (4 hours).
lights(): checks how many reported incidents have occurred between a given time interval and lights up the LEDs accordingly.
setup(): runs getDate() and getHour(), defines LED pins, and makes the first call to myHandler().
loop(): continuously calls myHandler every 60 seconds.
myHandler(): uses ArduinoJSON to retrieve an array of JSON objects from the API, iterates through the array to find cases that match last week's date, and counts how many of those cases occurred within a given four-hour interval. Calls lights() to turn on LEDs accordingly.Analysis & Conclusion:
Since I wanted to look for trends between the amount of crime that occurred and when it happened, I decided to examine three days worth of data.
Here are my findings:
Thursday, January 14th, 2021 (Examining 2021-01-07)
- 00:00-04:00: Green
- 04:00-08:00: Green
- 08:00-12:00: Green
- 12:00-16:00: Yellow
- 16:00-20:00: Yellow
- 20:00-00:00: Yellow
Friday, January 15th, 2021 (Examining 2021-01-08)
- 00:00-04:00: Green
- 04:00-08:00: Green
- 08:00-12:00: Green
- 12:00-16:00: Green
- 16:00-20:00: Green
- 20:00-00:00: Yellow
Saturday, January 16th, 2021 (Examining 2021-01-09)
- 00:00-04:00: Green
- 04:00-08:00: Green
- 08:00-12:00: Green
- 12:00-16:00: Green
- 16:00-20:00: Red
- 20:00-00:00: Green
Sunday, January 17th, 2021 (Examining 2021-01-10)
- 00:00-04:00: Green
- 04:00-08:00: Green
- 08:00-12:00: Green
- 12:00-16:00: Green
- 16:00-20:00: Green
- 20:00-00:00: Green
Based on 4 days of observations, it seems as there are more reported incidents of battery and assault in my neighborhood between the 16:00-20:00 (4pm-8pm CST) hour mark. I found this surprising because I expected it to see more cases beyond the 20:00 hour mark.
If I were to recreate this project again, I would include an LCD screen alongside the LEDs, so that I knew what the exact count was. I would also like to make a wearable bracelet that changes color based on the crimes committed in that specific location and time.


Comments