


Hardware components | ||||||
 |
| × | 1 | |||
| × | 1 | ||||
| × | 1 | ||||
| × | 1 | ||||
| × | 4 | ||||
| × | 1 | ||||
| × | 1 | ||||
| × | 1 | ||||
| × | 1 | ||||
| × | 1 | ||||
| × | 1 | ||||
_wzec989qrF.jpg?auto=compress%2Cformat&w=48&h=48&fit=fill&bg=ffffff) |
| × | 1 | |||
| × | 1 | ||||
| × | 1 | ||||
| × | 1 | ||||
| × | 1 | ||||
| × | 1 | ||||
| × | 1 | ||||
| × | 1 | ||||
| × | 1 | ||||
Hand tools and fabrication machines | ||||||
 |
| |||||
 |
| |||||
This project provides two different implementations of the same basic system. The first and simplest uses an Arduino Nano and controls up to eight valves using home brew moisture sensors for input. Interfacing with this system is through a home automation system. Home Assistant was chosen here with communication through a MySensors RF mesh network. The system can then be controlled from a portable device connected to the internet. I've tried to include everything you will need to successfully complete this phase.
A second phase uses the above baseline but replaces the Arduino Nano with an Arduino Mega. With this added processing capability, the second system incorporates temperature compensation for the moisture measurement and a host of error checking routines. This phase adds a touch screen for local control of the system. The software can be configured for pure touch screen control or both touch screen and Home Assistant control. This system is perfect for those who are not interested in incorporating home automation but still desire the functionality.
Project Layout DetailsThe phase I system is designed to irrigate from 1 to 8 planters or sections of a garden. The strategy used is simply to measure the moisture content of the soil using soil resistance sensors and if it’s too low, actuate a valve. Therefore, for eight planters, eight soil sensors and eight valves are needed. An Arduino Nano (controller) is used to effectuate the process for opening and closing valves, and to communicate information with a home automation system.
The block diagram in Figure 1 shows the interconnection of the various system elements. There are three major components of the system, the system electronics, the valve enclosure, and the plumbing components. The electronics include the Arduino mounted on a project specific PCB, two four channel relay boards, a terminal strip, and a 12V 2A power supply. For the system constructed and described here, there are two valve enclosures each containing four valves. The need for the enclosures arises because the valves with their electrical connectors are placed outdoors. The enclosure is meant to protect the valve connections from the elements. For an indoor application the enclosures are not needed and the valves can simply be mounted on a support structure. The final element is the plumbing. For this implementation, ¼ inch drip tubing is employed. This size is perfectly adequate for the 7” x 36” planters being irrigated, but might not be sufficient for larger areas or bigger planters. However, with relatively minor adjustments, the system can be modified to handle much larger valves (more on this later in this document). A set of five water sprinklers are connected to four 7” sections of tubing. The middle sprinkler connects to a tee where the water supply is connected. The sprinklers have flow adjustment capability which is useful for creating an even amount of water from each one.
Since this irrigation system is being placed outdoors, the electronics must be housed in a waterproof enclosure. In Figures 2 and 3, the lid and the box are shown separately with the lid containing the relays and a terminal strip and the box containing the Arduino, power supply and control electronics. The relays are four gang relays on two boards, totaling eight relays. While eight gang relay boards are available, they don’t fit in the box, but two four gang relay boards fit nicely. The terminal strip is used to simplify the electrical connections to the valves.
The valves are housed in two enclosures with four valves each (see Figure 4).
A flow meter was added to provide flow information and to help keep track of when and how often the plants are being watered. Data is stored in a Database in Home Assistant (if using). This data includes the state of all entities as a function of time. By looking at the state data, one can tell which valve has been opened and then correlate that to the flow meter data. SQL_lite is a great piece of freeware that helps explore the Home Assistant database.
The system shown in the cover figure is mounted below our deck on the wall of the building. Tubing runs from the system, underneath the deck and to the location of each of six planters that sit either on the deck railing or on the deck floor. Figure 5 is an image of one of the planters on the deck railing. The drip tubing and the electrical wire to the sensor are positioned behind railing post and not visible.
I have been successfully running a six valve system using an Arduino Nano for two months. But in setting this system in place, it became apparent that the Nano has limitations due to its program and memory space. Having written the software to measure both temperature and moisture it was not possible to compile the software for six valves without bumping into the memory headroom. Though somewhat disappointing, it is possible to provide irrigation control based only on the uncompensated moisture readings.
The Arduino Nano is also challenged with digital outputs. But this can be overcome using port expanders. In this implementation, an mcp23008 8 bit port i2c expander is used to control the eight valves. In the code, you will see that the port expander is addressed as a PORT and the outputs are controlled with functions that manipulate individual bits. The i2c interface is controlled by a bit bang library created by Larry Bank. This was necessary because the Arduino's built-in i2c interface uses two analog pins, but this system requires all of the available analog pins.
This circuit also includes a switched 5 volt output driver. This output is used for the moisture sensors. In a following section, details of the moisture sensors and the characteristics are detailed. But to foreshadow, the moisture sensors degrade in time due to electrolysis and/or other corroding effects. One way to avoid excessive degradation is to limit the amount of time power is applied to the sensors, thus the output driver. In the code, you will see that the moisture sensors are only driven for about ten milliseconds every 15 minutes when not watering, or every 6 seconds when watering. Included in the circuit is a header that provides the choice of using the driven supply or the Arduino output directly. I turns out that the Arduino sources enough current by itself to drive the moisture sensors effectively. Some issues may be avoided by driving Aref with the same output source.
Because this author extensively employs home automation in his dwelling, this irrigation system relies on a home automation system to display the moisture readings and to control all the functions. Home Assistant was used and the configuration files are provided. Of course, this requires a radio for communication (NRF24) and the library provided by the MySensors team. This does add overhead to the Arduino which might otherwise be used to interface with a display, but this is not implemented in this iteration (see the MEGA Irrigation System below). The code for the MEGA system might be ported to the Nano system, but this was not tested by this author.
The final feature of this circuit is that it provides connectivity for eight Dallas Semiconductor temperature sensors. The code provided does not include temperature sensing, but an energetic builder could take the code from the MEGA system for temperature sensing and port it to the Nano if desired, keeping in mind that the Nano's resources may not support that much code.
The circuit board for the Nano system was fabricated in China (JLCPCB) using the Fritzing files included with this project write-up. The board contains surface mount devices. For many, this might be a deterrent for its use, but be assured that this is not a significant barrier for anyone with a solder iron. Proceed by first coating one of the two SMD pads with solder (or if you prefer, just coat the pad with flux). Use a pair of tweezers to hold the device in place and with a flat tip soldering iron generously coated with solder and dipped in flux, gently touch the exposed pad and the SMD device with the iron. Solder will flow and secure the device to the board. With one end secured, use the flux dipped solder coat iron to secure the second pad. Easy! And faster than using leaded devices!
The rest of the system hardware is straight forward. The mcp23008 controls the relay boards. The relay boards control the valves. Note the use of a terminal strip connecting to the valves with shunting diodes to counter back emf (Figure 7 below).
You can't trust anyone. Moisture sensing is probably not as simple as you may imagine. The first implementation of this system incorporated commercially available sensors. They lasted a week during which a gradual degradation of system performance was observed. After tearing a bunch of hair out of my already balding head, I determined the the failure element was the moisture sensors. How could this be?
After a little investigation, it became apparent that the commercially available sensors were degrading do to corrosion and/or electrolysis (more corrosion than anything). After one week of use, the plated metallic surface of the sensor was entirely eaten away, rendering the device useless. Two aspects became immediately apparent; a thicker metal would probably last longer, and applying a voltage to the sensor even when measurements are not being made is a fool's errand. Further investigation of the commercially available sensors control electronics revealed that the only elements used for the "analog" output were a shunt capacitor and a series resistor (10KOhm). The rest of the components on their board were used to create a digital output. A digital output is not particularly useful in this application. So, one concludes that the circuit provided with the commercially available device is also useless. So, to summarize, there is no element provide by the commercially available product that is in the least useful for an irrigation system. Hmmm.
An associated eye opener in all this was that there is really no great complexity to the design of a moisture sensor. Literature shows that in many implementations of soil measurements, metal spikes are driven into the ground and a meter reads the resistance (current flow) between them. In many cases, a four point probe measurement is made.
Being a fundamentally frugal person, I determined to create a sensor using two 3.5" 16D nails supported by a 3D printed plastic supporting element and capped with a 3D printed plastic cap. The leads to the device are simply soldered onto the nail head (the very top, not the sides) and then strengthened with shrink tubing. A Dupont type connector is then crimped onto the leads to complete the device. A simple tool was constructed (once again in the 3D printed) to allow the nails to be driven through the supporting element without crushing the wires. All of the 3D printed elements necessary are provided in this project report.
Below in Figure 8a is a comparison of the commercially available and home brew moisture sensors.
The great news about the 6D nail design is that it lasts much longer than the commercially available version. However, corrosion in the soil is still a problem. In Figure 8b, a photo of a sensor is shown after about 2 months of operation. The sensor is still functioning and would probably continue to last an entire season. However, experimentation on sensor design determined that for longer life, 3mm 304 Stainless Steel rod is possibly the best material to use in moisture sensing. These are a direct replacement for the 16D nails used above ( using the same 3D Printed sensor support structures.
The final configuration is shown in Figure 8b below. Three millimeter 304 stainless steel rods were purchase from Amazon. The rods were then cut and one end of each was threaded to 6-32 using a die purchased from Amazon. The process of threading the rod was very easy. The plastic 3D printed support structure was reamed out to fit both the temperature sensor and the rods. For the temperature sensor, a 1/4 inch drill was used. This created a hole just slightly bigger than needed, but the set screw clamps it tightly in place. The holes for the rod were reamed to 7/64" and then the rods were force fit into the plastic holder. Two conductor cable was cut to the length of the Dallas Sensor leads and attached to the rods using the 6-32 nuts shown in the figure. The free end of the cables were connected to a water proof five conductor cable (see parts list). As an aside, I used Cat 5 cable to run from the sensors to the electrons. Cat 5 is relatively cheap and seems to be holding up fine. Cables are run under my deck, so they see very little sunlight.
To Fabricate the sensors, I found the following steps yield a good result.
- Fabricate the Sensor Support using the attached FreeCAD design file. Use 100% fill because you will later be drilling and threading these parts.
- The 304 steel rods come in 30mm lengths. Cut these into 7.5 mm rods (4).
- Mount the specified die into your vise. This particular Irwin die is perfect for the task in that it has an aligning entry hole that will be important when you are about to cut the rod. Of course, make sure the aligning hole is at the top surface when placing in the vice.
- Liberally oil the die with cutting oil. If you haven't got cutting oil, 3 in 1 will do. But no matter what, use some oil!
- Put your first rod in a viable speed drill with high torque. Align the rod and drill with the die's alignment hole and insert until it hits the cutting teeth.
- Start the drill slowly with a light downward pressure.
- Descend into the die about 1/2 inch or so.
- Back out the drill slowly while lifting with a light upward pressure.
- Test the cut by screwing on a 6-32 nut.
- Continue this process until all the rods are threaded.
- Place the first 3D printed Sensor Support in your vise so that the top surface is up. Use a 7/64" drill or ream to ream the two rod holes. Use a 1/4" drill to ream the temperature sensor hole.
- Place the Sensor Support on a flat surface and place the un-threaded end into one of the rod holes. Using a hammer with light taps, tap the rod until it penetrates the hole. Repeat with a second rod.
- Use the vice to support the Sensor Support so that the rods can pass through the open vice but the Sensor Support can not. Tap the rods into the Sensor Support until only the thread can be seen.
- Continue this process for all the available Sensor Supports.
- Using a 6-32 tap, tap the hole in the Sensor Support that is meant to lock the temperature sensor in place.
- Place two nuts on each threaded rod and place a set screw into the threaded hole.
- Crimp two lugs onto the ends of 2 conductor wire and place them on the exposed threaded end of the SS rods. Then add two more 6-32 nuts and clamp down.
- Cut the length of the two conductor wire to the same length as the Dallas Temperature Sensor lead and tie wrap them together at 4 or 5 points.
- Cut shrink tubing to protect the leads and cover the entire connection area. Solder the leads to the specified connector and then apply heat to shrink the tubing, first on the individual leads and then over the bundle. The final result should be as shown in Figure 8d below.
In initial testing, it was discovered that the sensor exhibited significant temperature sensitivity. In the early morning, a planter would measure a relatively high reading (indicating a low moisture content). As the day wore on and the ambient temperature increased, the indicated moisture content would increase. Of course the reality is that the moisture content of the planter had not changed or if it did, it would change in the opposite direction because the sun and plants would tend to dry out the soil. So, it became immediately apparent that the temperature sensitivity of the measurement might represent a problem.
It’s not surprising that such a simple sensor would have temperature sensitivity. In this case, the temperature sensitivity is fairly significant and should be addressed. But in order to do so, the temperature and moisture sensitivity have to be characterized. A simple experimental apparatus was configured comprising a drying oven, a Dallas Semiconductor temperature sensor, the moisture sensor just described and a container with a cap in which potting soil and sensors are placed. For the container, a 16 oz plastic tub with a cap was used. A slot was cut in the cap and the wires for the temperature and moisture sensors were fed through. A piece of electrical tape then sealed the wires to the lid. A sensor support structure was designed to hold both the moisture sensor and the Dallas temperature sensor as shown in Figure 10. The two nails of the moisture sensor and the Dallas Semiconductor temperature sensor snuggly fit into the holes in the support structure. This reduced the extension of the moisture sensing nails to 30 mm. Inside the container, the soil was placed and the sensors embedded so that the support structure was at the surface of the soil.
The experiment was conducted by first drying the soil (MiracleGro Potting Soil) completely. The oven dryer was set to 160 F and ran for about four hours. To insure the dryness, a silica pack was placed on top of the soil. When the pack’s color changed to purple, the soil was assumed to have dried completely. The container was filled to about the halfway point in the container and tamped down. The level of the soil was then marked on the container with a pen. The moisture sensor placed in the dry soil measured an open circuit. It took three teaspoons added one at a time before the moisture sensor reading appeared.
So starting with 3 tsps, the container was loaded into the oven and the temperature set to 130F. The temperature was allowed to rise until it reached its maximum, at which point, it was left at temperature for an additional 30 minutes to insure that it stabilized. At that point, the oven was turned off to remove any electromagnetic interference and data was taken as the system cooled. During the cooling, the Arduino conducted measurements. This process was repeated with an additional volume of water each time until twenty tsps of water had been placed in the soil and the measurements conducted. At 7 tsps, a repeatability test was conducted resulting in nearly identical readings. Before measuring the response to 8 tsps of water, the soil was again dried completely and eight tsps of water were added. The soil was mixed thoroughly and the volume of the soil before and after introducing the water was marked on the container.
An Arduino was programmed to measure both sensors, and send the data to it’s serial port every few seconds. Before really getting started, it was observed that the reading changed with time, everything else held constant. From initial reading to final asymptotic reading was about 35 seconds. Therefore, the Arduino was programmed to take an initial reading, wait 35 seconds and take a second reading. Additionally, the Arduino was configured so that it could apply power to the moisture sensor through a digital I/O pin. Thus, the sequence established was to apply power to the moisture sensor and take an immediate reading, wait 35 seconds and take a second reading, remove power, and wait 35 seconds for the next reading sequence.
The first set of measurements comprising water content from three to sixteen teaspoons are plotted in Figure 10 below. The soil resistance is derived from Aout (sensor analog output) through the following equation:
Rsoil = Rseries / 1024/Aout - 1, Eq. 1
where: Rseries = 10,000 Ohms.
In this work, the soil moisture is defined as the ratio of the water weight added to the total weight of the mixture. Therefore, it the weight of the dried soil sample is wsoil and the weight of the water is wwater, then the % soil moisture (M%)is given as:
M% = wt. water / (wt. water+ wt. soil). Eq. 2
The weight of the dry soil used in this experiment was 2.2 oz. Each teaspoon of water weighs 0.1733625 oz.
Data AnalysisThe raw data shown in Figure 11 above is replotted in Figure 12 below where the Output Voltage has been converted to resistance using equation 1. and the water content expressed as a volume percentage with an offset. During data collection, it was observed that three tsps of water were required before the resistance was measurable in the experimental set-up. In observing the log-log plot without the offset, it became apparent that the data followed closely to a power series with a negative exponent. But because a substantial volume of water was needed before the effect could be observed, it was reasoned that the mathematical relationship might include an offset. Using a spreadsheet, the offset was made adjustable and varied to observe the results on the log-log plot. It seemed to optimize the R2 value when set to about 16%.
A partial set of the data collected is shown in Figure 13 below with the Soil Resistance plotted against the Temperature at eight different moisture levels. The data is plotted on a log-log plot. Physical phenomena that are driven by thermal energy are often plotted as a function of the log of the temperature. When translated into a mathematical expression, such data will be related to the exponential of the temperature (ekT).
The first thing to notice about this data is that the three (tsp) data has the greatest deviation from the fitted line with an R2 value of only 0.772. The reason for this is that all the data plotted is at the top end of the analog input range. Thus, the measurement is low accuracy. As resistance values drop, the accuracy increases. At the mid way of the range and below, the accuracy once again diminishes and the quality of the data at low moisture levels declines.
A second thing worth observing is that the data often tend to deviate above the fitted line at high temperature. The reason for this is due to the experimental set-up. As mentioned earlier, a delay of about ½ hour was imposed before data was taken from a high temperature to a low temperature. This was apparently not enough time. So, before the oven was turned off, the Resistance hadn’t reached its minimum but the oven temperature was already declining. As the oven temperature fell, the readings began to lag the temperature. But at the same time, the rate of temperature decline was slowing, giving the soil more time to equilibrate. Therefore, the best data, that taken at the lowest ∆T/∆t, is taken at the lower temperatures.
Based on the data shown in Figure 13, the equation relating the soil resistance to the soil moisture level can be written as:
Rsoil = A(T)(M%)^B(T), Eq. 3
Where the parameters A and B are functions of temperature. To create a mathematical model for the system where we can predict the soil resistance using both the temperature and moisture, we need to examine the temperature dependence of the parameters in the Eq. 3. Table 1 below lists the parameters as a function of temperature. These are plotted in Figure 14.
Then, with the above, the temperature dependence of the parameters in Eq. 3 can be written as:
A(T)= -0.0112T+2.52 Eq. 4
and,
B(T)=-3.610-3T-3.6. Eq. 5
Finally, Eq. 3 can be inverted to predict the soil moisture level from the measured resistance and the soil temperature:
M% = {Rsoil/10^A(T)}^(1/B(T)). Eq. 6
Sensitivity ConsiderationsThe accuracy discussion above also relates to the sensitivity of the sensor which will be a function of the series resistance and the soil moisture range under analysis. One might rightly wonder which is the best value of series resistance to use for a particular type of soil and moisture range. So, the first thing to tackle is the definition of sensitivity in this application. Since the sensor is used in a voltage divider, one could define the sensitivity as:
S = ΔV/ΔM%, Eq. 7
Where;
M% is the soil moisture level, and
V is the Output Voltage.
To make things simpler, we can just look for the optimized V/R picking the value of Rat the midpoint of the soil moisture range at a temperature we assume to be the midpoint of the temperature range we are likely to encounter. For example, looking at the table from AccuRite, let’s assume we will operate in the green range (40% to 60%). Then from Figure _, the sensor resistance will be between about 1.1 KΩ and 0.9 KΩ, with a mid range value of 1 KΩ. The Output Voltage will be:
Vout = 5v * (Rsensor)/(Rseries + Rsensor). Eq. 8
So we are seeking to maximize Vout/Rseries|Rsensor a job made a bit easier by substituting:
x = Rsensor/Rseries and dRsensor = Rseries dx. . Eq. 9
Then the equation can be rewritten in unitless terms helping to avoid mistakes thusly;
Vout = 5v * x / (1 + x) . Eq. 10
So after performing the derivative and substituting
x = Rsensor/Rseries,
we get:
S = δVout/δRsensor = -5V/Rseries/(1 + Rsensor/Rseries)^2; Eq. 11
We need to know when S is maximized, so we have to take the derivative again, but this time with respect to Rseries to get::
δS/δRseries = (5v/Rsensor)/( Rseries/Rsensor)*(1 + Rsensor/Rseries); Eq. 12
Making substitution similar to above we can rewrite the equation as:
δS/δRseries = (5v/Rsensor)d/dx [1/( x (1 + 1/x)^2]; Eq. 13
Its solution is:
δS/δRseries = (5v/Rsensor)(1-x)/(1+x)^3, Eq. 14
which crosses the x axis when x = 1. Therefore, the optimum value of Rseries is Rsensor. So, depending on the desired soil moisture, Rseries should be chosen at the center resistance valve for the expected resistance range. In this work a value of 10K was used which turns out to be a good value to cover the broad range of values measured in this study. But for use with our spice garden, the expected median value of Rsensor is about 1000Ω, which is the value of resistance used in the final sensor conditioning circuit. Assuming the minimum value of Rsensor is 600Ω, then the maximum current drawn from the transistor switching power to the sensors is 5v/(1600/8) or about 25 mA.
The commercially available sensor uses a 10K series resistor which is ten times larger than the one suggested by this work. Theirs may have been selected with minimizing galvanic action in mind. But in this implementation, the sensor will only be powered a fraction of the time. So what is that fraction? It must be based on the moisture level in the soil which changes slowly over many hours. Therefore, the need for measurements is only perhaps every 15 (7500 seconds) or 30 (15000 seconds) minutes. The signal conditioning circuit has a 100 nF capacitor across the sensor with the 1K series resistance. Its time constant is 10^(-7)F * 10^3Ω, or = 10^-4seconds. As indicated previously, a 10 millisecond power pulse was chosen and provides a large safety margin.
Dallas Temperature SensorsThe MEGA Irrigation System uses Dallas temperature sensors to obtain soil temperature and compensate the moisture reading, using the formulas developed above. These amazing devices use a single input pin on the Arduino in this project. These "One Wire" devices, in other words, share a single data line. A library available on Github will need to be downloaded along with a second library for the temperature sensors. Once installed, you'll be able to compile the MEGA Irrigation System code.
In the OneWire communication protocol, each sensor has an address and can be identified and interrogated use this address. The code requires the address of each Dallas Temperature sensor used in your implementation. To obtain this address, I modified a bit of example code available on Github. I called this code "Dallas Sensor Address Display Routine." It does exactly that; it display the address of a single sensor. It also prints out the temperature readout. So while obtaining the sensor's address, you can also check to see if it is responsive by warming it with your fingers.
To obtain the addresses for all the devices, I used the program and the Irrigation System board along with an Arduino Uno. The Irrigation System Board will plug into the Uno which can access all the necessary pins. The pins on the board are labeled and as you can see, pin 13 is used for the OneWire data line. There are eight temperature sensor input ports on the board. Any sensor can be plugged into any port because they all share the same data line. Therefore, any port will do the job. So, plug your sensor in any port and run the program. The program prints the address and the temperatures in both Fahrenheit and Centigrade. Label you sensors so you know which is which. I labeled mine 0 thru 5 (six sensors) and also put an address label on each sensor.
Labeling will help when installing the system, which can be confusing when the temperature sensors can be plugged into any port. This, of course, is not true for the moisture sensors for which each has its own port. So, a moisture sensor plugged into port 0 will coincide with the valve associated with the 0 bit of PORTA. The valves connect to drip tubes that go to particular pots. So, in the end, the sensor put into a particular pot (or area) needs to coincide with the valve that waters that pot. In my implementation I labeled both ends of the cables and the tubing that go to a sensor/pot combo. Pot 0 got sensor 0 connected to cable 0 and irrigated by tube 0 connecting to valve 0.
Finally, with all that sorted, you will need to associate temperature sensor's address with with the pot/sensor/tube combo. Using the program described above, you will know the address of temperature sensor 0. In the MEGA Irrigation System code, find the section below:
//Addresses of DS18B20 sensors connected to the 1-Wire bus
byte sensor0[8] = {0x28, 0xAA, 0x5B, 0xE4, 0x52, 0x14, 0x01, 0x92};
byte sensor1[8] = {0x28, 0x51, 0x6C, 0x74, 0x54, 0x20, 0x01, 0xEB};
byte sensor2[8] = {0x28, 0xEA, 0x5A, 0x9A, 0x54, 0x20, 0x01, 0x50};
byte sensor3[8] = {0x28, 0xC0, 0x74, 0x8A, 0x54, 0x20, 0x01, 0x4B};
byte sensor4[8] = {0x28, 0x07, 0x2A, 0x88, 0x54, 0x20, 0x01, 0x61};
byte sensor5[8] = {0x28, 0x7E, 0x88, 0x78, 0x54, 0x20, 0x01, 0xAE};
and put in the address you've obtained. Ta Da, you're good to go.
Arduino MEGA Irrigation SystemMoving to an Arduino MEGA removes all the limitations imposed by the Nano. Now there is more than enough memory space to handle both the MySensors library, the Dallas Semiconductor Temperature sensors and the display and touch screen library. There are a number of ways to configure this system. The simplest is with the display but without MySensors (no home automation interface). In this system, everything is controlled from the touchscreen. The purpose of the three different screen pages will be explained below. The drawback of this system is that you have to be at the controller to make changes to the system. A second implementation includes the display, and adds MySensors. In this case, the control of the system is either from the touch screen or from the home automation software (Home Assistant is used here). This system can be controlled from any place where the internet can be accessed. This is the ultimate configuration to be used by this author largely because I could :-). The fact is that the only reason I created the touch screen interface is so that folks who do not want to take on the extra burden of learning to use a home automation system can still benefit from this otherwise simple Irrigation System.
So, what other elements are added in the MEGA Irrigation System?
- The MEGA system uses all of the eight temperature sensors.
- Because the processor is more capable, the calculation of the %M from the resistance is performed locally, and of course, the temperature dependence is added.
- New alarms are implemented. Apart from just knowing if a sensor is not performing or if the water is not flowing, this system adds the determination of the presence or absence of a temperature sensor and whether a moisture sensor is open or shorted. All 16 of the sensors (8 temps and 8 moisture) are monitored separately and displayed.
- The system allows the user to modify the moisture range for each of the eight zones individually. Here you can irrigate cacti along side of tomatoes, for example. These settings are stored in eeprom, so upon loss of power, the settings will be restored upon power-up.
- A separate board that includes electronic drive for the original eight valves and one extra valve has been added. The extra valve is applied to the water source connection allowing the system to cut off the source in the event of a leak. Of course, this board also eliminates the need for separate relay boards.
- All of the boards are stackable on the Arduino Mega. With the display, sensor board, and valve driver board installed, the stack height is about 2 ½ inches.
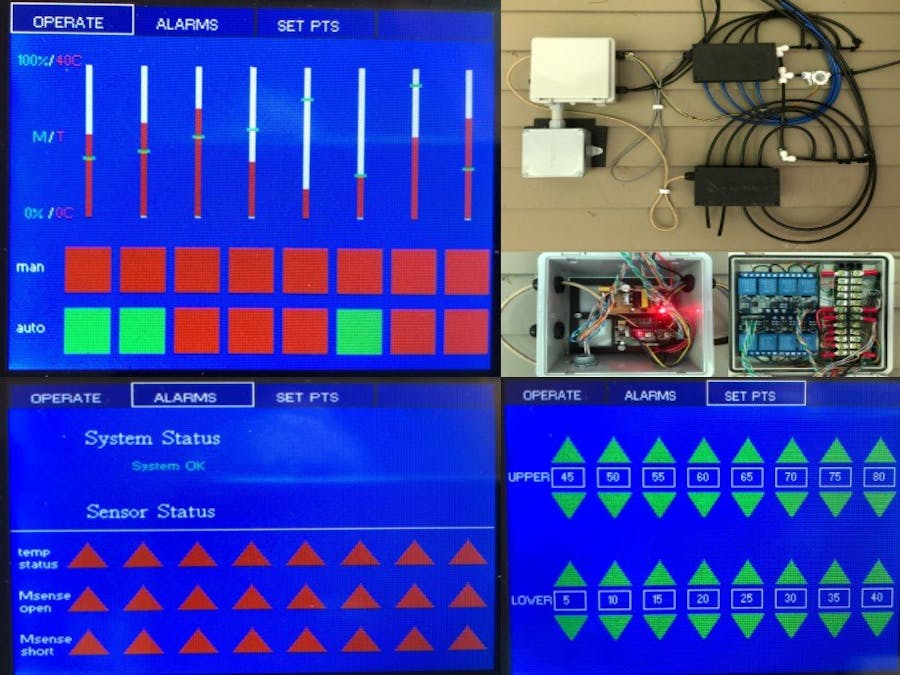
In figure 15 below, the Operations page for the MEGA system is shown. This page provides a view of the temperature and moisture levels for all eight zones. The bar graphs provide both moisture and temperature information with the moisture shown as a light blue horizontal line indicating a value between 0% and 100%, and the temperature in red (like a thermometer) indicating a value between 0C and 40C.
Included on this screen are a set of eight manual buttons corresponding to the eight zones whose temps and %Ms are plotted above. A red square indicates a valve that is not actuated. Touching that square will turn it green and actuate the associated valve. Of course system alarm conditions are still monitored and when necessary the system will turn off any valves necessary. Recall from the prior discussion that only one valve can be actuated at once. So, if a second zone is selected by touching a red square, the currently actuated zone will shut down and the newly selected zone will be activated.
The set of eight squares below the manual buttons control the mode (either automatic or manual). If red, the zone is under manual control. If green, automatic. Once a zone is selected for automatic mode, the associated manual valve will be disabled and turned of is currently actuate. A zone under automatic zone will not permit manual operation. Any number of zones can be selected for automatic control.
In Figure 16 below, the Alarms page is shown. This page is divided into two sections. The top section provides the "System Status." This is similar to what is available in the Nano system. I provides three warnings when necessary; low flow, open sensor, and leak detected. It will display one, two or all three conditions. If everything is OK, it indicates so as shown in the figure. It may be important to know that an "open sensor" is any unresponsive sensor. That sensor may not actually be open, but could have a constant value or might even be shorted. If any sensor satisfies those condition, this alarm will indicate. These conditions are only evaluated when a valve is commanded to be open.
Below the System Status is a section providing information about the condition of the individual sensors. For the row entitled "temp status", if a temperature sensor is not available, its associated triangle will be red, otherwise green. The next two rows down are for the moisture sensors, indicating opens and shorts. Once again, a good sensor will be green. Looks like we're in serious trouble below.
The final page provides the ability to control the set points for each of the eight zones. The first row of controls is for the upper set point. The up and down arrows act conventionally. The lower row corresponds to the lower set point. Although it is possible to adjust the settings such that the lower set point is above the upper one, the system will not allow the user to leave this page, and will not implement the changes until the errant zone is corrected. The errant zone will display red triangles until corrected.
note: I have completed testing on this system and the software has been uploaded. Deployment has not occurred in my planters as of yet.
The final system hardware includes an Arduino MEGA, a driver board, the sensor interface board with both moisture and temperature capability, and the display. This is shown in Figure 18 and 19 below. This system is quite compact and measures less than 3" tall as seen in Figure 20. This will easily fit in the box specified for this project. Additionally, the wiring inside the box is significantly reduced. No components need be mounted on the box cover because the relay boards and the terminal strips are eliminated in this version. Valves are wired directly to the driver board. It should be noted that this system will operate without the temperature sensors. If one or more are missing, the software substitutes a value of 22C for the temperature of that zone.
The driver board is shown in Figure 21. I contains 9 1.5 amp drivers which employ a BD140 power transistor. As mentioned before, the valves require about 1/2 Ampere to operate. Even at this current level, the transistors dissipate enough power to get warm. Each transistor has been bent to 90 degrees (effectively into the plane of the PCB) and aluminum heatsinks have been added. Eight drivers are dedicated to the eight valve capacity of the system. The ninth valve is a shutoff valve. In an early implementation of this system, a leak was discovered by observing a small flow rate when all valves were closed. The shutoff valve was added to the water supply line. As are the other valves, it is a normally close valve. The final version of the software opens the shutoff valve each time a zone valve is open. When no zones are being watered, the shutoff valve remains off except for an occasional leak check (about two second duration). If a flow rate of over 1 ml/second is observed, a message is sent to Home Assistant triggering an automation that sends an email alarm.
Each individual drive circuit contains two transistors, the PNP BD140 mentioned earlier and an NPN transistor as the trigger. This configuration permits a low voltage signal from the Arduino to drive the 12 Volt output required by the valves. Each valve coil is shunted by a reverse polarity diode sinking back EMF current. The drive voltage for the valves is connected to a two pin header which is not connected to the Arduino's Vin. Thus, the voltage supplied to the valves can be from a separate supply. In testing for this project, it was not necessary to provide separate supplies for the valves and Arduino.
The drive board is over sized, allowing the terminal connectors to the valves to extend beyond the length of the MEGA, as can be seen in Figure 21. This provides easy access for hookup to the valves with the system stack is in place.
In Figure 22 below, the final MEGA configuration is shown. In this set-up, I used two equivalent 12Volt supplies, one for the Arduino Mega stack and the other to drive the valves. The MEGA version required a slightly larger waterproof box. The installation is much cleaner than the one for the Arduino Nano which required the relay boards. Mounting the relay boards on the cover meant that wires needed to run between the cover and the lower portion of the box. Here, there is nothing mounted on the cover.
The Home Assistant Lovelace interface is shown in Figure 23. It's been compressed a bit from the Nano interface by removing the individual moisture gauges and combining them into a single glance card. The gauge for the flow rate remains. Vertical stacks delineate the 'Controls' from the 'Sensors' and 'Operational Status.'
So, regarding the controls, they remain the same as in the Nano implementation. In manual mode, individual valves can be actuated, but only one valve can be turned on at a time. Each zone can be configured individually for automatic or manual operation. If a zone in automatic configuration has actuated a valve, no manual valve is permitted to be actuated. Also included in the same vertical stack is an 'Alarm' panel. It displays the day/night indicator. The system will only allow watering at night. I might be interesting instead to add a light sensor and seek a light level for bright sunlight as opposed to cloudy or night, thus allowing activation in cloudy weather. As with the Nano, the system restart switch permits resetting alarm states. When the system detects a low flow condition or an open moisture sensor, it automatically shuts down in order to prevent over watering. Once the issue has been resolved, the user can actuate the 'reset' switch which causes the system to reset the alarm indicators within the software and permit operation to resume.
The 'Sensors' panel shows the flow sensor gauge, with the moisture and temperature sensors as glances. The 'Operational Status' stack provides information on the sensors for each zone. For moisture sensors, open and shorted sensors are indicated. In the case of the temperature sensors, the absence or presence is indicated.


Comments
Please log in or sign up to comment.